DEMENTIA MORTALITY
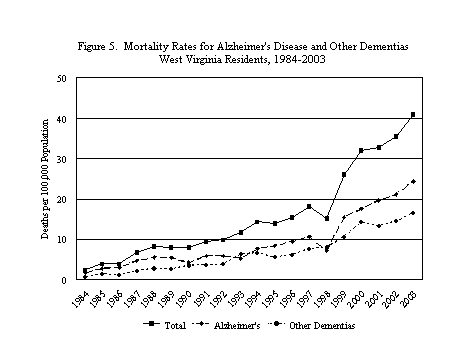
Most people who suffer from dementia do not die from the disease itself but from a secondary condition such as pneumonia or complications from a fall. Even so, the rate of deaths with Alzheimer’s disease or other dementia listed as the underlying, or primary, cause of death is increasing. Figure 5 shows the trends in mortality from AD, other dementias, and total dementias from 1984 through 2003 (actual rates are found in Appendix B). Coding changes in 19998 likely accounted for the marked increase in rates in that year; however, both pre-1999 and post-1999 rates show a consistent upward trend.

This increase can be attributed to several factors, including more awareness of AD and other dementias, earlier diagnosis of the illnesses, and an aging population. AD first appeared in the 10 leading causes of death in West Virginia in 2000; nationally this occurred in 1999. By 2002, AD was the eighth leading cause of death in both the state and the nation.
Figure 6 illustrates the upward trend in dementia mortality by gender over the same 20-year period. While the increase is apparent among both sexes, with similar rates until 1999, women have been more likely to die from dementia than men since 2000. (Individual rates are found in Appendix B, as well as a breakdown between Alzheimer’s disease and other dementias.)

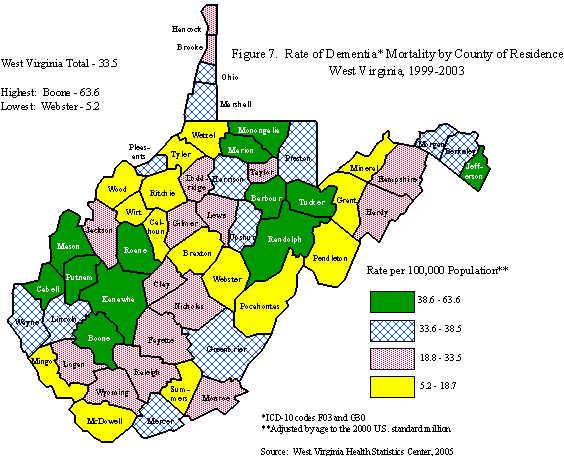
County-Specific Mortality Rates. Data on dementia mortality were aggregated for the years 1999-2003 in order to examine deaths on the county level and are presented in Figure 7 on the next page. Mortality rates for dementia ranged from a high of 63.6 deaths per 100,000 population in Boone County to a low of 5.2 in Webster County. The highest rates are found in the west-central and northern sections of the state. Individual county rates and ranks are found in Appendix C.
State and National Dementia Mortality Rates Among Older Adults. At the time this report was prepared, the National Center for Health Statistics (NCHS) had published (on-line) mortality rates from 1982 through 2001 for selected causes, including Alzheimer’s disease, among people aged 65 and older of both sexes and all races. These data are presented with comparable West Virginia rates in Figure 8. As can be seen, the overall age-specific rates were similar in both the state and the nation throughout the 20-year time period.


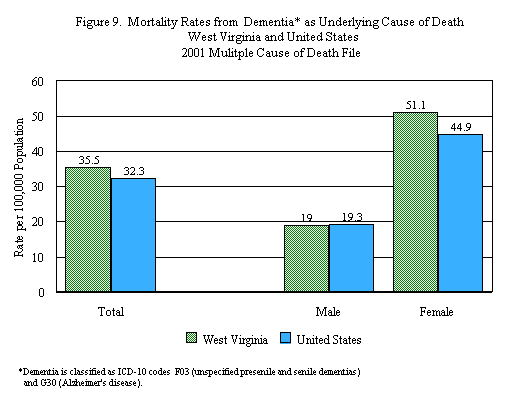
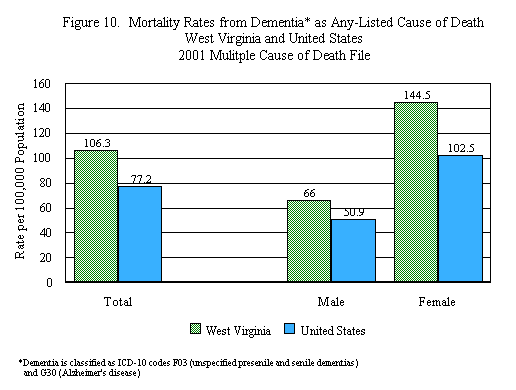
Multiple-Cause-of-Death Data. The National Center for Health Statistics (NCHS) compiles and collects data on all deaths in the United States according to ICD-10. The information collected by NCHS is released on annual multiple-cause-of-death tapes that include the following: decedent’s age, sex, race, and state of residence; the underlying cause of death, and contributing causes of death (up to 19 additional causes). This analysis examines multiple-cause-of-death data related to dementia for West Virginia and the United States for 2001. Overall, as shown in Figure 9, the mortality rate for dementia as the underlying cause was nearly 10% higher in West Virginia than in the United States as a whole. While virtually no difference was seen among men, the rate among state women was 14% higher than their counterparts elsewhere. Overall mortality rates for dementia as an any-listed (underlying or contributing) cause were 38% higher in the state than in the nation, with higher rates among both state men and women (Figure 10).

While higher overall rates of dementia mortality are not unexpected in the state due to West Virginia’s older population, it would be expected that these differences would decrease with age-specific rates if age were the only factor involved. As Table 4 shows, these differences persist in West Virginia among women aged 65-84 with dementia diagnosed as the underlying cause of death and among both sexes with dementia diagnosed as an any-listed cause.

| Table
4. Mortality Rates (per 100,000 Population) for Dementia* by Gender and Age West Virginia and United States, 2001 Multiple Cause of Death File |
||||
|---|---|---|---|---|
| Underlying Cause | Any-Listed Cause |
|||
| West Virginia | United States | West Virginia | United States | |
| Male 0-64 Total |
0.4 19.0 |
0.4 19.3 |
1.0 66.0 |
1.2 50.9 |
| Female
0-64 Total |
0.3 51.1 |
0.4 44.9 |
1.0 144.5 |
1.0
67.3 102.5 |
| Both Sexes
0-64 Total |
0.3 35.5 |
0.4 32.3 |
1.0 106.3 |
1.1 77.2 |
*Dementia is classified as ICD-10 codes F03 (unspecified presenile and senile dementias) and G30 (Alzheimer’s disease). Rates were calculated using the 2000 census populations.
8 A new cause-of-death classification, International Classification of Disease, Revision 10 (ICD-10), was introduced in 1999, superceding ICD, Revision 9 codes that had been in use since 1979. The difference in coding resulted in slightly higher rates for some causes.