DEMENTIA DIAGNOSES IN HOSPITAL RECORDS
Hospital discharge data provide an additional source of information on the prevalence of disease and the burden on the state. Data from the West Virginia Health Care Authority (WVHCA) were used to determine the rate of hospitalizations that included any diagnosis of dementia. The WVHCA collects inpatient data from all nonfederal licensed hospitals in the state and Medicare data on West Virginia residents hospitalized in out-of-state hospitals. Up to nine diagnoses (one principal and eight secondary) are recorded and coded according to the International Classification of Diseases, 9 th Revision, Clinical Modification (ICD-9-CM).
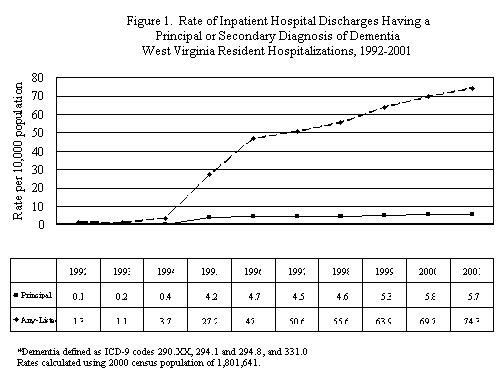
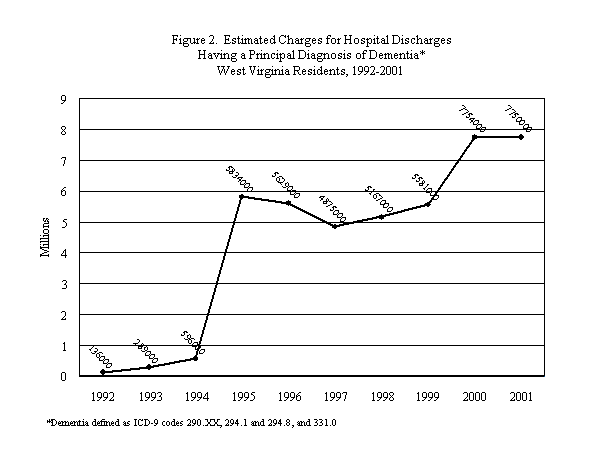
1992-2001 Hospitalizations. The overall rate of hospital discharges among state residents with a principal or secondary diagnosis of dementia from 1992 to 2001 ranged from a low of 1.1 per 10,000 discharges in 1993 to a high of 74.3 in 2001. The total charges billed for hospitalizations with a principal diagnosis of dementia ranged from $136,000 in 1992 to $7,750,000 in 2000. The dramatic increases in diagnoses and charges related to dementia (shown in Figures 1 and 2) reflect both an increase in the state’s older population and an enhanced awareness of the condition, especially AD.
2001 Hospitalizations. Approximately 5% of all discharges both nationally and statewide in 2001 had dementia as either a principal or secondary diagnosis. In West Virginia, 13,390 of 252,983 resident discharges, or 5.3%, included a dementia diagnosis; nationally, about 1,651,000 of 32,653,000 discharges, or 5.1%, had such a diagnosis.
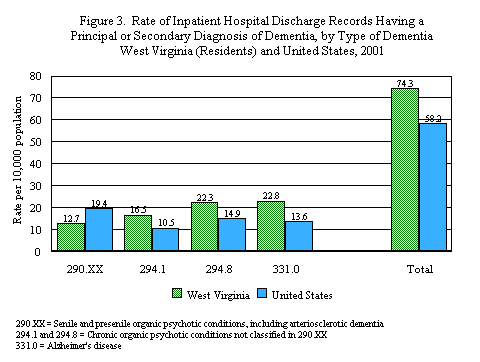
West Virginia’s rate (per 10,000 population) of hospitalizations with a diagnosis of dementia in 2001 was 74.3, compared with a rate of 58.2 for the United States, a difference of 28%. (Part of this difference is due to the fact that West Virginia had a rate of total discharges in 2001 that was 22% higher than that for the nation as a whole.) When looking just at AD, the state rate was 68% higher than the national rate. As Table 2 shows, the state had higher rates of dementia diagnoses among both men and women and among patients aged 65 and older. Only among patients aged 45-64 was the state rate equal to or lower than the national rate.


| Table
2. Rate (per 10,000 Population) of Resident Inpatient Hospital Discharge Records Having a Principal or Secondary Diagnosis of Alzheimer’s Disease or Other Dementia, by Gender and Age West Virginia and United States , 2001 |
||||||
|---|---|---|---|---|---|---|
| West Virginia | United States | |||||
| Alzheimer’s | Other* | Total | Alzheimer’s | Other* | Total | |
| Total | 22.8 | 51.6 | 74.3 | 13.6 | 44.5 | 58.2 |
| Gender | ||||||
| Male | 14.5 | 33.8 | 48.3 | 12.6 | 31.1 | 43.7 |
| Female | 30.6 | 68.3 | 98.9 | 20.8 | 55.9 | 76.7 |
| Age | ||||||
| 45-64 | 1.2 | 6.0 | 7.2 | 1.2 | 8.5 | 9.8 |
| 65+ | 146.6 | 326.0 | 472.7 | 107.4 | 342.0 | 449.4 |
| *Senile, presenile, and other organic psychotic conditions, including arteriosclerotic dementia Rates calculated using 2000 census populations. | ||||||
When broken out by most frequently diagnosed types of irreversible dementia, illustrated in Figure 3, the overall state rate of senile and presenile organic psychotic conditions, including arteriosclerotic dementia, is shown to be lower than the U.S. rate. Dementia resulting from other chronic organic psychotic conditions and AD, however, is diagnosed more frequently among West Virginia residents than in the United States as a whole.

2001 Hospitalization Charges. In 2001, approximately $7,750,000 was billed for hospitalizations of West Virginia residents with a principal diagnosis of dementia, $3.3 million for AD and $4.4 million for other dementias. Approximately 90% of these charges were billed to Medicare, as would be expected, with the remaining 10% divided somewhat evenly among Medicaid, PEIA, and other payers.

County-Specific Rates. The rate of hospital discharges having a principal or secondary diagnosis of dementia in 2001 ranged from a high of 122.5 per 10,000 discharges among Logan County residents to a low of 9.4 among Hardy County residents. As shown in Figure 4, the highest rates of dementia among patients were reported in the southern counties of West Virginia, while the lowest rates were concentrated in the eastern part of the state. Individual county rates and ranks are found in Appendix A.