The Burden of OSTEOPOROSIS in West Virginia
Contents
Exec. Sum.
Overview
Detection
Risk Factors
Prevention and Treatment
WV Prevalence
NOF Prevalence
Fractures Model
Hospitalizations
WV and US
Costs
Appendix A
Appendix B
Appendix C
Appendix D
References
OSTEOPOROSIS-RELATED HOSPITALIZATIONS
Hospitalization discharge data provide valuable insight into the burden of osteoporosis in West Virginia. Data from the West Virginia Health Care Authority's (HCA's) database were used to estimate osteoporosis-related hospitalizations among West Virginia residents in 1996. HCA collects inpatient discharge data from all nonfederal licensed hospitals in the state and Medicare data on West Virginia residents hospitalized in out-of-state hospitals, including information on patient age, sex, and length of stay. Discharges are coded according to the International Classification of Diseases, 9th Revision, Clinical Modification (ICD-9-CM). This study presents data on hospitalizations of West Virginia residents aged 45 and older with a primary diagnosis of a fracture of the hip, spine, forearm, or other site. The proportion of each fracture category attributed to osteoporosis was determined using a method developed by an expert panel convened by the National Osteoporosis Foundation, the details of which are found in Appendix D.
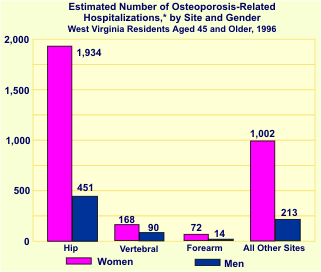
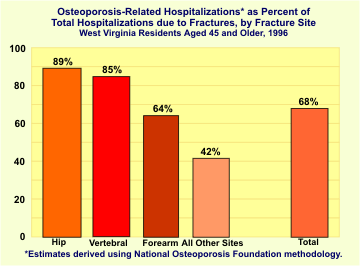
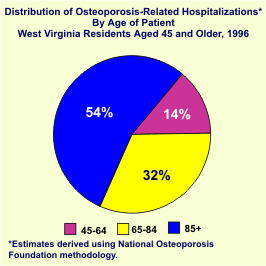
The table on the following page summarizes 1996 HCA data on the estimated number of discharges, total inpatient charges per discharge, and the average length of stay per discharge by type of fracture. Over two-thirds (3,944 or 68.1%) of the 6,015 hospitalizations due to fractures among persons aged 45+ were osteoporosis related. The majority (60.4%) of these fractures involved the hip, while 6.5% involved vertebrae, 2.2% the forearm, and 30.8% other sites. Among osteoporotic fractures, women accounted for 81.1% of hip fractures, 65.1% of vertebral fractures, 83.7% of forearm fractures, and 82.5% of other fractures. More than half of the hospitalizations (54.6%) involved persons aged 65 through 84, with nearly one-third (31.8%) of the patients aged 85 and older.
Over $42 million was billed in 1996 for hospitalizations due to osteoporotic fractures; this represented 65.0% of total charges for all fractures among persons aged 45+ ($65 million). Two-thirds (66.3%) of osteoporosis-related charges were for patients with hip fractures. Four percent (4.3%) of total osteoporotic charges involved vertebral fractures, 1.4% involved forearm fractures, and 28.1% involved fractures of other sites.
The average length of stay for osteoporotic fractures was 9.31 days for men and 8.83 days for women. By far, hip fractures required the longest stays, an average of 10.39 days among men and 9.89 days among women. Not surprisingly, forearm fractures resulted in the shortest average stays: 3.75 days for men and 3.79 days for women. Men had longer average stays for hip and other site fractures, while women had slightly longer stays for vertebral and forearm fractures.
Overall, women accounted for approximately four out of every five (80.5%) osteoporotic fracture hospitalizations, men for 19.5%. However, the average hospital charge per fracture was lower for women regardless of fracture site. Combining all osteoporotic fractures, the average charge among female patients was $10,219; the average charge among male patients was $13,166.
|
SELECTED HOSPITALIZATION DATA FOR
OSTEOPOROSIS-ATTRIBUTABLE FRACTURES,* BY
GENDER AND AGE (Primary Diagnosis Only) West Virginia Residents Aged 45 and Older, 1996> |
|||||||
|---|---|---|---|---|---|---|---|
| Age | Male | Female | |||||
| Number of Discharges | Total Charges ($) | Average Length of Stay (Days) | Number of Discharges | Total Charges ($) | Average Length of Stay (Days) | ||
|
Hip (ICD 820) |
|||||||
| 45-64 | 51 | 630,290 | 9.02 | 81 | 1,041,915 | 8.81 | |
| 65-84 | 278 | 3,969,199 | 11.06 | 1,089 | 12,268,546 | 10.11 | |
| 85+ | 122 | 1,458,499 | 9.44 | 764 | 8,847,446 | 9.69 | |
| Total | 451 | 6,057,988 | 10.39 | 1,934 | 22,157,907 | 9.89 | |
| Vertebral (ICD 805) | |||||||
| 45-64 | 43 | 464,008 | 5.48 | 29 | 220,750 | 7.69 | |
| 65-84 | 32 | 269,717 | 6.72 | 90 | 476,496 | 5.76 | |
| 85+ | 15 | 89,555 | 6.47 | 49 | 296,676 | 7.48 | |
| Total | 90 | 823,280 | 6.07 | 168 | 993,922 | 6.59 | |
| Forearm (ICD 813.4-813.5) | |||||||
| 45-64 | 8 | 90,170 | 3.95 | 16 | 114,598 | 2.87 | |
| 65-84 | 5 | 34,821 | 3.58 | 39 | 259,965 | 4.06 | |
| 85+ | 1 | 4,248 | 3.00 | 17 | 77,505 | 4.05 | |
| Total | 14 | 129,239 | 3.75 | 72 | 452,068 | 3.79 | |
| All Other Sites (ICD 800-829) | |||||||
|---|---|---|---|---|---|---|---|
| 45-64 | 74 | 905,507 | 6.67 | 236 | 2,185,672 | 5.58 | |
| 65-84 | 104 | 1,691,734 | 9.58 | 516 | 4,876,198 | 8.17 | |
| 85+ | 35 | 503,582 | 10.63 | 250 | 1,790,614 | 8.04 | |
| Total | 213 | 3,100,823 | 8.74 | 1,002 | 8,852,484 | 7.53 | |
| TOTAL | 768 | 10,111,330 | 9.31 | 3,176 | 32,456,381 | 8.83 | |
| *Estimates derived using National Osteoporosis Foundation methodology. | |||||||


Comparison of Osteoporosis-Related Hospitalizations, WV and US