
Contents
| WV | DHHR | BPH | OCHSHP | HSC |
Obesity:
Facts, Figures, Guidelines
Section 2 - Continued
Obesity in West Virginia
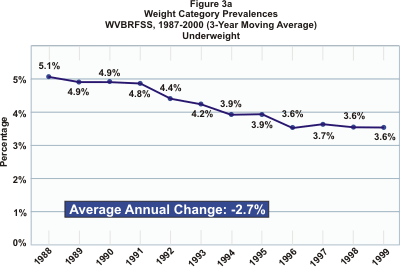
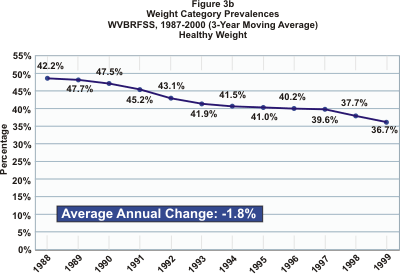
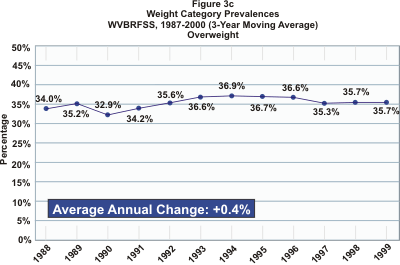
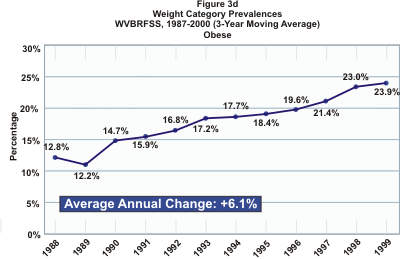
Weight Category Prevalences. To chart changes in weight among the state’s adults, the four weight categories defined by the National Institutes of Health were used, i.e., underweight (BMI <18.5); healthy, or normal, weight (BMI 18.5-24.9); overweight (BMI 25.0-29.9), and obesity (BMI 30.0+). To fully understand the upward trend in the prevalence of obesity, it is necessary to examine the trends of the other three weight categories. Figure 3 illustrates the course over time of all four weight categories in West Virginia.
Using a moving three-year average to eliminate yearly aberrations or spikes in prevalence, the graphs clearly indicate that the greatest changes have occurred in the categories of underweight, with an average annual decrease of 2.7%, and obesity, with an average annual increase of 6.1%. The prevalence of healthy weight has decreased approximately 1.8% per year, while that of overweight has changed very little, with only a 0.4% increase annually from 1987 through 2000. By far, the most dramatic change has been in the prevalence of obesity.
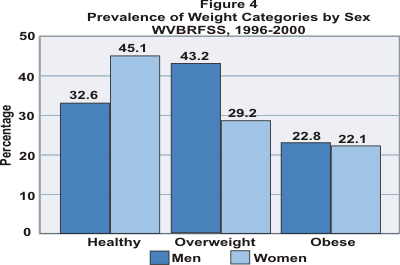
BRFSS data were aggregated from 1996 through 2000 in order to examine the prevalence of obesity, as well as overweight and healthy weight6, by selected characteristics. As shown in Figure 4, little difference was found in obesity prevalence among men and women. However, men were nearly half again as likely as women to be overweight; conversely, women were 38% more likely to report a healthy weight.
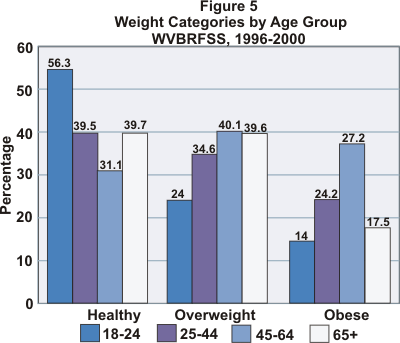
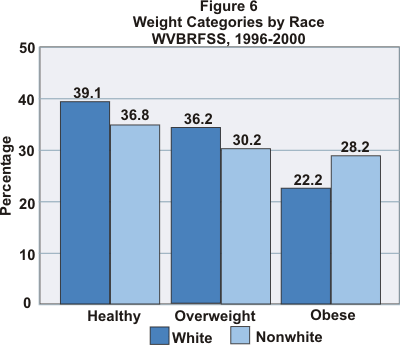
Middle-aged adults (aged 45-64) were more likely to be either overweight or obese than adults of other ages (Figure 5). Young adults aged 18-24 were the most likely to report a healthy weight; even so, just over half of this age group had a BMI in the healthy range. Nonwhite residents were less likely than white residents to be a healthy weight or be overweight and were more likely to be obese (Figure 6).
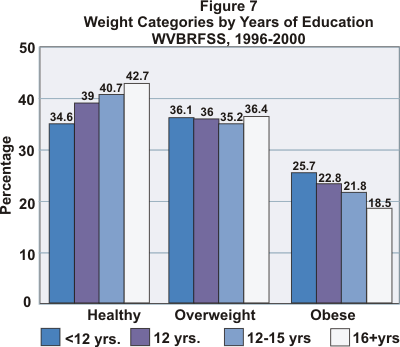
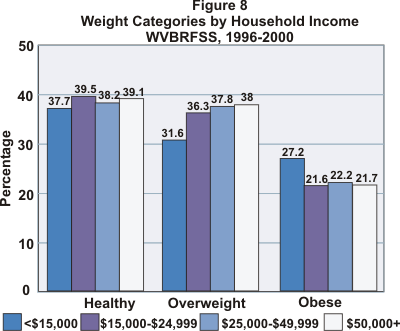
An association between weight and educational level was noted within the categories of healthy weight and obesity, with respondents having at least a college degree more likely to report a healthy weight and less likely to be obese (Figure 7). Respondents with the highest household incomes also were more likely to have a healthy BMI and less likely to be obese (Figure 8).
6Underweight respondents were omitted from further analysis for two reasons. First, the sample sizes of adults meeting the definition of underweight were too small to allow meaningful comparisons; secondly, it was not possible to control for such factors as ongoing illnesses that might be underlying cause of underweight. Return to Text
- Weight Category and Health Status
- Chronic Disease Prevalence
- Weight Category and Seatbelt Nonuse
- Prevalence and Weight Reduction
- Dietary Intake Study
- Obesity and other Cardiovascular Disease Risk Factors
- Overweight among West Virginia's Youth
- Physical Activity among West Virginia Youth
- Health Care Expenditures due to Obesity in West Virginia
- Top of Page