 Message from the Commissioner Executive Summary Table of Contents Section I. Prevalence Section II. WV Cigarette Consumption Section III. Deaths in WV due to Smoking Section IV. Health Care Costs Related to Smoking SAMMEC References Credits |
|
||||||||||||||||||||||||||||||||||||||||||||||||||||||||||||||||||||||||||||||||||||||||||||||||||||||||||||||||||||||||||||||||||||||||||||||||||||||||||||||||||||||||||||||||||||||||||||||||||||||||||||||||||||||||||||||||||||||||||||||||||||||||||||||||||||||||||||||||||||||||||||||||||||||||||||||||||||||||||||||||||||||||||||||||||||||||||||||||||||||||||||||||||||||||||||||||||||||||||||||||||||||||||||||||||||||||||||||||||||||||||||||||||||||||||||||||||||||
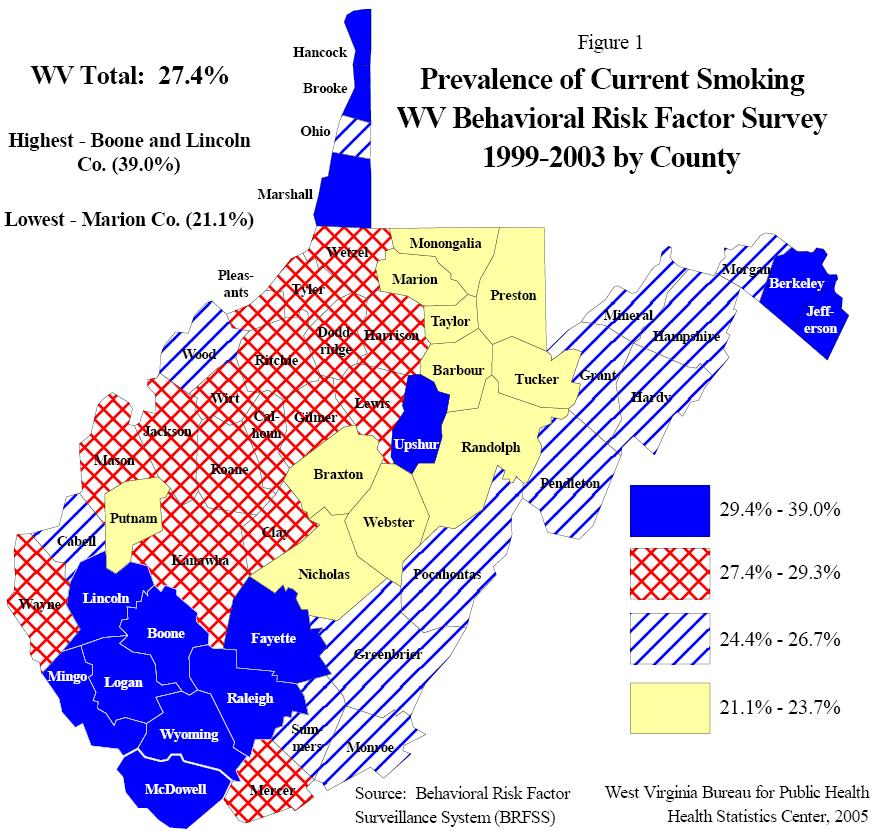
| Table 1 Prevalence (%) of Current Smoking by County WVBRFSS, 1999-2003 |
|||||
|---|---|---|---|---|---|
| County | % | Rank* | County | % | Rank* |
| Barbour | 23.6 | 31 | Monongalia | 22.6 | 34 |
| Berkeley | 32.5 | 6 | Monroe | 24.6 | 28 |
| Boone | 39.0 | 1 | Morgan | 26.7 | 23 |
| Braxton | 21.8 | 35 | Nicholas | 21.8 | 35 |
| Brooke | 31.5 | 8 | Ohio | 26.4 | 25 |
| Cabell | 24.7 | 27 | Pendleton | 24.4 | 29 |
| Calhoun | 29.0 | 15 | Pleasants | 28.6 | 18 |
| Clay | 29.0 | 15 | Pocahontas | 24.4 | 29 |
| Doddridge | 29.3 | 14 | Preston | 23.7 | 30 |
| Fayette | 30.7 | 10 | Putnam | 22.9 | 33 |
| Gilmer | 29.0 | 15 | Raleigh | 30.4 | 11 |
| Grant | 25.6 | 26 | Randolph | 23.3 | 32 |
| Greenbrier | 24.6 | 28 | Ritchie | 29.3 | 14 |
| Hampshire | 26.7 | 23 | Roane | 29.0 | 15 |
| Hancock | 30.1 | 12 | Summers | 24.6 | 28 |
| Hardy | 24.4 | 29 | Taylor | 23.6 | 31 |
| Harrison | 27.8 | 20 | Tucker | 23.7 | 30 |
| Jackson | 28.3 | 19 | Tyler | 28.6 | 18 |
| Jefferson | 29.4 | 13 | Upshur | 32.2 | 7 |
| Kanawha | 27.4 | 22 | Wayne | 28.9 | 17 |
| Lewis | 29.3 | 14 | Webster | 21.8 | 35 |
| Lincoln | 39.0 | 1 | Wetzel | 28.6 | 18 |
| Logan | 35.5 | 2 | Wirt | 28.3 | 19 |
| McDowell | 32.9 | 4 | Wood | 26.7 | 24 |
| Marion | 21.1 | 36 | Wyoming | 32.6 | 5 |
| Marshall | 30.8 | 9 | Total WV | 27.4 | |
| Mason | 28.9 | 16 | Total US | 22.7 | |
| Mercer | 27.5 | 21 | |||
| Mineral | 25.6 | 26 | |||
| Mingo | 33.8 | 3 | |||
| Note: The data from counties sharing the same rank were combined due to low sample sizes. Aggregated sample sizes were large enough for 24 of the 55 counties to stand alone. The data from the remaining 31 counties were combined into 12 groupings of counties. Each county within a grouping shares the same prevalence. *Rates are rounded to the nearest tenth; ranks were determined before rounding. |
|||||
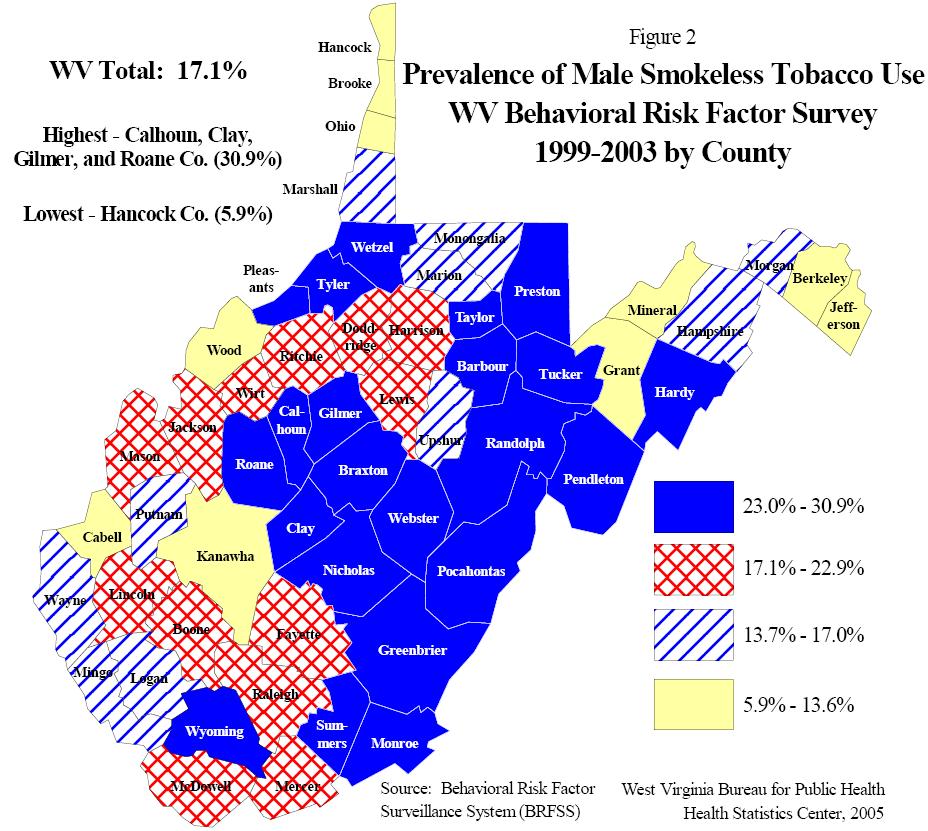
| Table 2 Prevalence (%) of Smokeless Tobacco Use (Men) by County WVBRFSS, 1999-2003 |
|||||
|---|---|---|---|---|---|
| County | % | Rank* | County | % | Rank* |
| Barbour | 23.0 | 9 | Monongalia | 14.2 | 25 |
| Berkeley | 11.6 | 33 | Monroe | 23.6 | 8 |
| Boone | 20.6 | 13 | Morgan | 15.8 | 20 |
| Braxton | 30.3 | 2 | Nicholas | 30.3 | 2 |
| Brooke | 11.8 | 32 | Ohio | 11.9 | 31 |
| Cabell | 10.1 | 34 | Pendleton | 28.4 | 3 |
| Calhoun | 30.9 | 1 | Pleasants | 26.0 | 5 |
| Clay | 30.9 | 1 | Pocahontas | 28.4 | 3 |
| Doddridge | 20.9 | 12 | Preston | 24.0 | 7 |
| Fayette | 19.7 | 14 | Putnam | 14.2 | 26 |
| Gilmer | 30.9 | 1 | Raleigh | 21.9 | 10 |
| Grant | 13.6 | 28 | Randolph | 24.0 | 6 |
| Greenbrier | 23.6 | 8 | Ritchie | 20.9 | 12 |
| Hampshire | 15.8 | 20 | Roane | 30.9 | 1 |
| Hancock | 5.9 | 36 | Summers | 23.6 | 8 |
| Hardy | 28.4 | 3 | Taylor | 23.0 | 9 |
| Harrison | 17.6 | 18 | Tucker | 24.0 | 7 |
| Jackson | 21.3 | 11 | Tyler | 26.0 | 5 |
| Jefferson | 6.0 | 35 | Upshur | 15.7 | 22 |
| Kanawha | 13.0 | 29 | Wayne | 14.6 | 24 |
| Lewis | 20.9 | 12 | Webster | 30.3 | 2 |
| Lincoln | 20.6 | 13 | Wetzel | 26.0 | 5 |
| Logan | 14.1 | 27 | Wirt | 21.3 | 11 |
| McDowell | 18.8 | 17 | Wood | 12.8 | 30 |
| Marion | 15.2 | 23 | Wyoming | 28.1 | 4 |
| Marshall | 15.9 | 19 | Total WV | 17.1 | |
| Mason | 19.6 | 15 | |||
| Mercer | 19.0 | 16 | |||
| Mineral | 13.6 | 28 | |||
| Mingo | 15.8 | 21 | |||
| Note: The data from counties sharing the same rank were combined due to low sample sizes. Aggregated sample sizes were large enough for 24 of the 55 counties to stand alone. The data from the remaining 31 counties were combined into 12 groupings of counties. Each county within a grouping shares the same prevalence. *Rates are rounded to the nearest tenth; ranks were determined before rounding. |
|||||
| Previous Section - Executive Summary | Next Section - Section II |