Contents
| WV | DHHR | BPH | OEHP | HSC |
Obesity:
Facts, Figures, Guidelines
Section 2 - Continued
Obesity in West Virginia
Weight Category and Health Status. Self-perceived health status was ascertained by asking respondents if in general they thought their health was excellent, very good, good, fair, or poor. Figure 9 shows how perceived health status is associated with weight. Obese individuals were far less likely than their leaner counterparts to describe their health as excellent or very good; conversely, they were more likely to report only fair or poor health.

Although obese individuals were more likely to report having only fair or poor health, they were less likely to have health insurance than their overweight counterparts, as shown in Figure 10. Nearly one-fourth (23.6%) of obese adults aged 18-64 reported in 2000 that they had no health care coverage.

Weight Category and Chronic Disease Prevalence. Excess weight has been linked to many chronic diseases including heart disease, diabetes, asthma, hypertension, and osteoarthritis. Data from the West Virginia BRFSS surveys allowed an examination of relationships between weight and the prevalence of these diseases among the state’s adults. Figure 11 illustrates the prevalence of having had a heart attack by weight category. While only 5.4% of respondents of healthy weight reported a heart attack, over twice as many, or 11.4%, of obese respondents had suffered a heart attack.

Hypertension prevalence data from 1999 (the most recent available at time of publication) are presented in Figure 12. As with having had a heart disease, the lowest prevalence of high blood pressure was reported by adults of healthy weight. Overweight individuals reported hypertension at a rate nearly 60% higher than their normal-weight counterparts, while obese respondents were more than twice as likely to have been told they had high blood pressure.

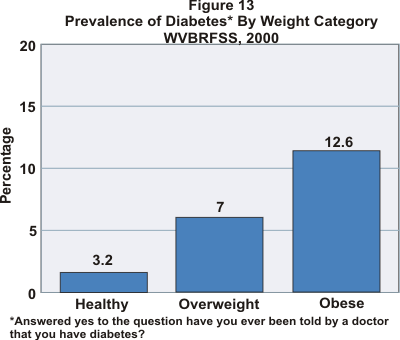
The association between weight and diabetes is even more striking, as illustrated in Figure 13. Only 3.2% of those with a BMI of 18.5-24.9 had ever been told they had diabetes. Seven percent (7.0%) of overweight respondents had diabetes, however, while 12.6% of obese West Virginians surveyed from 1996-2000 had been diagnosed with diabetes.

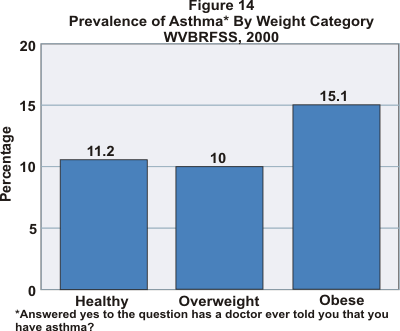
A clear-cut association between asthma and weight was not evident in the 2000 BRFSS data. As shown in Figure 14, little difference in asthma prevalence was noted among respondents who reported a healthy weight or were overweight. Obese persons were more likely, however, to report having been diagnosed with asthma.

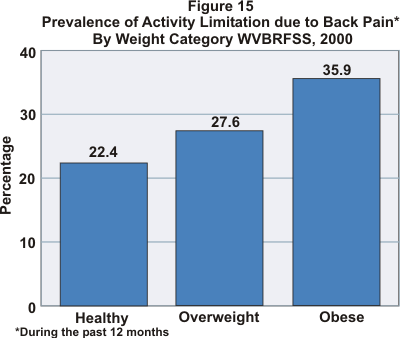
One of the questions asked respondents to the 2000 Behavioral Risk Factor Survey if they were limited in any way during the previous 12 months because of back pain. The graph below illustrates clearly the direct association between weight and activity limitation due to back pain. While approximately one in five (22.4%) respondents who were of healthy weight answered yes to this question, 35.9% of obese persons had been limited in some of their activities because of back pain.
