Contents
| WV | DHHR | BPH | OEHP | HSC |
Obesity:
Facts, Figures, Guidelines
Section 2 - Continued
Dietary Intake Study. A 2001 study by Krummel et al. on dietary intake and leisure-time physical activity among adult West Virginians found similar overall caloric intake among state residents and national respondents to the NHANES III survey (92). West Virginia men averaged 2,501 kcal daily, compared with 2,478 among males nationally. The mean caloric intake for West Virginia women was 1,720 kcal, compared with 1,732 for NHANES III female respondents.
The Krummel study examined the proportion of West Virginians surveyed who met the dietary recommendations for reducing chronic disease risk published by the national Committee for Diet and Health (93). Three-quarters (75%) of those surveyed met the daily recommendation for dietary cholesterol, while 70% met that for percentage of calories obtained from protein. Fewer than half (42%) ate a healthy percentage of total fat in their daily diets, and only one in five (20%) ate the recommended amount of dietary fiber. Even worse, only 18% of respondents got enough folate daily and only 10% obtained the recommended amount of Vitamin E. Concerning findings on leisure-time activity, the study’s author writes, “Diet and activity levels were modestly related, suggesting that those who adopt a healthy diet also become more active or vice versa.”
Obesity and Other Cardiovascular Disease Risk Factors. Although obese persons are at increased risk for cardiovascular disease from their excess weight alone, most have other CVD risks as well, making weight control even more imperative. Health professionals recognize that a combination of risk factors can have a synergistic effect on the chances of developing cardiovascular disease, as well as the severity of the disease. Data from the 2000 BRFSS were examined in terms of the prevalence of multiple CVD risk factors (i.e., current smoking, hypertension, high cholesterol, and physical inactivity) among those respondents who were obese. The results are presented in Table 2.
| Table 2 Prevalence of Respondents at Risk for CVD due to Obesity, Current Smoking, Hypertension, High Cholesterol, and/or Physical Inactivity 2000 West Virginia Behavioral Risk Factor Surveillance System |
|
|---|---|
| Obesity Only | % at Risk |
| Two risk Factors |
32.4 |
| Obesity and Hypertension | 11.8 |
| Obesity and Physical Inactivity | 8.6 |
| Obesity and Current Smoking | 7.1 |
| Obesity and High Cholesterol | 4.9 |
| Three Risk Factors | 26.4 |
| Obesity, Hypertension, and High Cholesterol | 9.5 |
| Obesity, Hypertension, and Physical Inactivity | 6.7 |
| Obesity, Current Smoking, and Physical Inactivity | 3.8 |
| Obesity, Current Smoking, and High Cholesterol | 1.7 |
| Obesity, Current Smoking, and Hypertension | 1.5 |
| Four Risk Factors | 16.1 |
| Obesity, Hypertension, Physical Inactivity, and High Cholesterol | 8.6 |
| Obesity, Current Smoking, Hypertension, and High Cholesterol | 3.7 |
| Obesity, Current Smoking, Hypertension, and Physical Activity | 2.5 |
| Obesity, Current Smoking, Physical Inactivity, and High Cholesterol | 1.3 |
| Five Risk Factors | 2.9 |
| Obesity, Current Smoking, Hypertension, Physical Inactivity, and High Cholesterol | 2.9 |
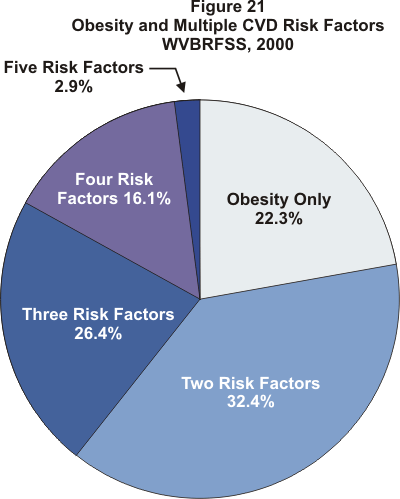
In 2000, 23.2% of the adults surveyed by the BRFSS were obese. Of this subpopulation, 22.3% did not report having any of the other four CVD risk factors in our analysis. Nearly one-third (32.4%) had one other risk factor, with the largest percentage of these persons (11.8%) reporting hypertension as the other risk factor. Twenty-six percent (26.4%) of obese respondents had two additional risk factors, 16.1% reported three additional risk factors, and 2.9% had all five risk factors, that is, they smoked, had high blood pressure and high cholesterol, and were physically inactive in addition to being obese. Figure 21 illustrates the prevalence of multiple CVD risk factors among the state’s obese adults in 2000.

Overweight among West Virginia’s Youth. The data available on the problem of overweight among our state’s youth are limited. The latest statistics available at the time of this report were obtained from the 1999 Youth Risk Behavior Survey.7 The categories of overweight and at risk of overweight were determined using the definitions for childhood obesity given in Chapter One.8 Overall, 12.2% of West Virginia high school students in grades 9 through 12 were overweight in 1999, 15.8% of males and 8.3% of females. Sixteen percent (15.9%) of students were at risk of overweight, 16.5% of males and 15.4% of females. In contrast, female students were much more likely to think that they were overweight, 42.5% compared with 27.2% of males. An even greater disparity between the sexes was noted for those students who had tried to lose weight at some time during the 30 days prior to the survey, 65.0% of females vs. 30.1% of males. Table 3 illustrates the differences between the national median and West Virginia students. Questions on daily diets revealed that only one in five students ate five or more servings of fruits and vegetables each day (20.4%) or drank at least three glasses of milk (19.1%)
| Table 3 Prevalence (%) of High School Students Who Were Overweight or AT Risk of Becoming Overweight9, thought They Were Overweight, and Who Were Attempting Weight Loss 1999 YRBS, United States and West Virginia |
||||||
|---|---|---|---|---|---|---|
| Total | Male | Female | US | WV | US | WV | US | WV |
| Overweight | 9.9 | 12.2 | 11.9 | 15.8 | 7.9 | 8.3 |
| At Risk of Overweight | 16.0 | 15.9 | 17.5 | 16.5 | 14.4 | 15.4 |
| Thought They Were Overweight | 30.0 | 34.7 | 23.7 | 27.2 | 36.4 | 42.5 |
| Attempting To Lose Weight | 42.7 | 47.0 | 26.1 | 30.1 | 59.4 | 65.0 |
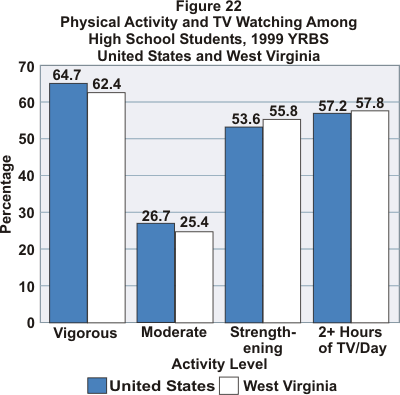
Physical Activity among West Virginia Youth. Seventy percent (70.0%) of male high school students reported during the 1999 YRBS survey that they participated in vigorous physical activity,10 compared with 54.2% of the female students. Another 27.3% of males participated in moderate physical activity, 11as did 23.5% of female students. Sixty-four percent (63.9%) of males and 47.6% of females had participated in strengthening exercises.12 On the negative side, 54.9% of males and 60.7% of females watched at least two hours of television on an average school day. As Figure 22 illustrates, little difference was noted between state students and the national median in terms of activity and TV watching.

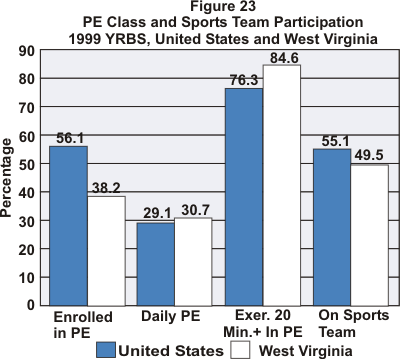
Only 38.2% of West Virginia high school students were enrolled in physical education (PE) class at the time of the survey, 44.4% of males and 31.6% of females. Thirty-four percent (34.1%) of males and 27.1% of females attended PE class daily. Of those students enrolled in PE, 87.1% of males and 81.3% of females reported exercising at least 20 minutes during an average class. Overall, half (49.5%) of the students had played on a sports team during the 12 months preceding the survey, 55.2% of males and 43.6% of females. Figure 23 compares West Virginia students to the national median.

Health Care Expenditures due to Obesity in West Virginia. Data are unavailable at the present time to estimate total health care expenditures due to obesity in West Virginia. Preliminary analyses have been conducted, however, using data from the Bureau of Medical Services (Medicaid) and the Public Employees Insurance Agency (PEIA) (94, 95). An economic model developed by the Centers for Disease Prevention and Control was applied to claims from covered individuals during FY2001 for four disease states associated with obesity, as well as the pharmacy costs related to those disease states. Tables 4 and 5 present the estimated medical expenditures for each payor.
It is estimated that together PEIA and Medicaid had over $200 million in obesity-related expenditures in FY2001. The highest costs of medical care related to obesity for both Medicaid and PEIA were found among individuals with claims related to cardiovascular disease. Total obesity-related medical costs paid by PEIA were nearly $29 million, while those paid by Medicaid were $36 million. Nearly $40 million in pharmacy costs to PEIA were attributed to obesity, with more than twice that amount, or almost $100 million, paid by Medicaid.
| Table 4 Public Employees Insurance Agency Estimated Medical and Pharmacy Costs Related to Obesity-Related Diseases West Virginia, July 1, 2000 - June 30, 2001 |
|||
|---|---|---|---|
| Disease State | FY2001 Medical Expenditues | % of Persons with Disease Who Are Obese* | Obesity-Related Costs |
| Diabetes | $3,436,144.10 | 80% | $2,748,915.28 |
| Cardiovascular | 33,518,763.60 | 62% | 20,781,633.43 |
| Musculoskeletal and Gout | 19,798,107.63 | 25% | 4,949,526.91 |
| Cancer (Pancreas, Stomach, Colon, Liver, Kidney) | 2,068,576.98 | 19% | 393,029.63 |
| Total Medical | $28,873,105.25 | ||
| Pharmacy Costs (Related to Above Disease States) | $39,416,289.86 | ||
| Total PEIA Expenditures | $68,289,395.11 | ||
| *Based on CDC estimates | |||
| Table 5 Medicaid Estimated Medical and Pharmacy Costs Related to Obesity-Related Diseases West Virginia, July 1, 2000 - June 30, 2001 |
|||
|---|---|---|---|
| Disease State | FY2001 Medical Expenditures | % of Persons with Disease Who Are Obese* | Obesity-Related Costs |
| Diabetes | $8,086,390.52 | 80% | $6,469,112.42 |
| Cardiovascular | 38,493,489.60 | 62% | 23,865,963.55 |
| Musculoskeletal and Gout | 22,155,875.70 | 25% | 5,538,968.93 |
| Cancer (Pancreas, Stomach, Colon, Liver, Kidney | 1,708,667.75 | 19% | 324,646.87 |
| Total Medical | 36,198,691.77 | ||
| Pharmacy Costs (Related to Above Disease States) | 99,187,082.45 | ||
| Total Medicaid Expenditures | $135,385,774.22 | ||
| *Based on CDC estimates | |||
7Results from the 2001 YRBS survey were unavailable for West Virginia due to loss in transit of a portion of the actual survey forms. Return to Text
8Overweight includes those students who were BMI-for-age>or=95th percentile; at risk of overweight includes those students who were BIM-for-age>or=85th percentile but <95th percentile. Return to Text
9Overweight includes those students who were BMI-for-age>or=95th percentile; at risk of overweight includes those students who were BIM-for-age>or=85th percentile but <95th percentile. Return to Text
10Activities that caused sweating and hard breathing for at least 20 minutes on at least thre of the seven days preceding the survey. Return to Text
11Activities that did not cause sweating or hard breathing for at least 30 minutes on at least five of the preceding seven days preceding the survey. Return to Text
12Such as push-ups, sit-ups, or weightlifting on at least three of the seven days preceding the survey. Return to Text