
Contents
| WV | DHHR | BPH | OEHP | HSC |
Obesity:
Facts, Figures, Guidelines
Section 2 - Continued
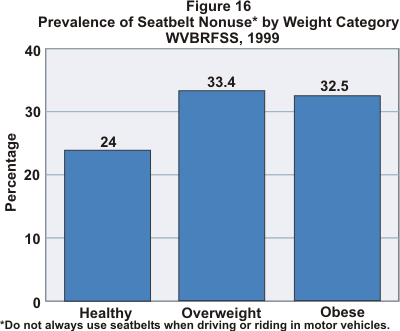
Weight Category and Seatbelt Nonuse Prevalence. Overweight and obese persons were less likely than other respondents to always use seatbelts when driving or riding in a motor vehicle. Approximately one in three overweight and obese respondents did not always buckle up, compared with fewer than one in four healthy weight respondents.
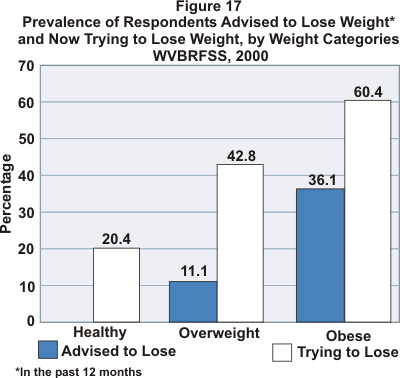
Weight Reduction. Only slightly over one-third (36.1%) of the obese respondents to the 2000 BRFSS reported that they had been advised to lose weight during the previous 12 months by a doctor, nurse, or other health professional; however, 60.4% were currently trying to lose weight (Figure 17). Eleven percent (11.1%) of overweight individuals had been advised to lose weight, with fewer than half (42.8%) actually trying to reduce. One in five (20.8%) healthy weight respondents reported they were currently attempting to lose weight.
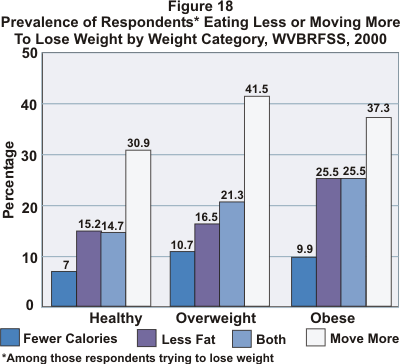
Among those respondents who reported they were currently trying to lose weight, obese persons were more likely than healthy weight or overweight persons to report eating less fat or a combination of fewer calories and less fat to reduce (Figure 18). Forty-two percent (41.5%) of overweight and 37.3% of obese respondents who were currently trying to lose weight reported doing more physical activity in order to achieve weight loss.
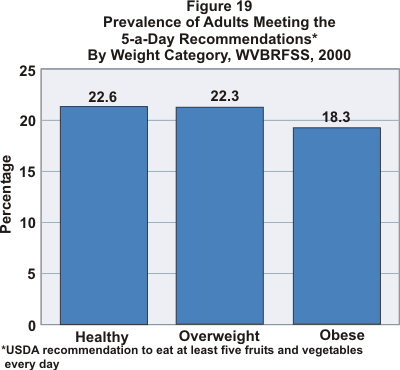
Any weight reduction or control program must involve a healthy, balanced diet. Part of such a diet is the consumption of at least five fruits and vegetables a day, according to U.S. Department of Agriculture (USDA) recommendations. When the prevalence of West Virginia adults meeting the USDA recommendation was examined by weight category (Figure 19), obese respondents were the least likely to include an adequate number of servings of fruits and vegetables in their daily meals.
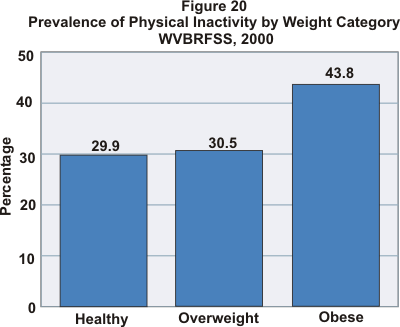
Little difference was noted in prevalence of physical inactivity among healthy weight and overweight respondents to the 2000 BRFSS survey. As Figure 20 shows, however, obese persons were much more likely to have reported no participation in any leisure-time physical activity during the month preceding the interview.
The following links will take you to different sections of the final web page in section 2. The are listed in the order they appear on the page.