 "2006 Vital" Executive SummaryTables Population
Other Information GraphicsMethodology Definitions Rates & Ratios ICD10 Groupings Statistics and Trivia - You must use the "BACK" button to return to this page. Other on-line HSC publications can be found at: PUBLICATIONS The Health
Statistics Center is located at:
|
West Virginia Vital Statistics - 2006
|
|||||||||||||||||||||||||||||||||||||||||||||||||||||||||||||||||||||||||||||||||||||||||||||||||||||||||||||
| Population | Live Births | Deaths | YPLL | Infant Deaths | Neonatal/postneonatal deaths | Fetal Deaths | Marriages| Divorces and Annulments | Induced Termination | Paternity Affidavit | Summary |
Population
In 2006, 282 West Virginians were added to the total population as a result of natural increase, the excess of births over deaths. The rate of natural increase was 0.16 persons per 1,000 population. Results from the 2006 Census estimate show an overall increase (approximately 0.6%) in the states population since 2000, from 1,808,344 to 1,818,470. This increase is the result of a slight growth in the excess of in-migration over out-migration during that span, as well as the natural increase.
Top of Page
Live Births
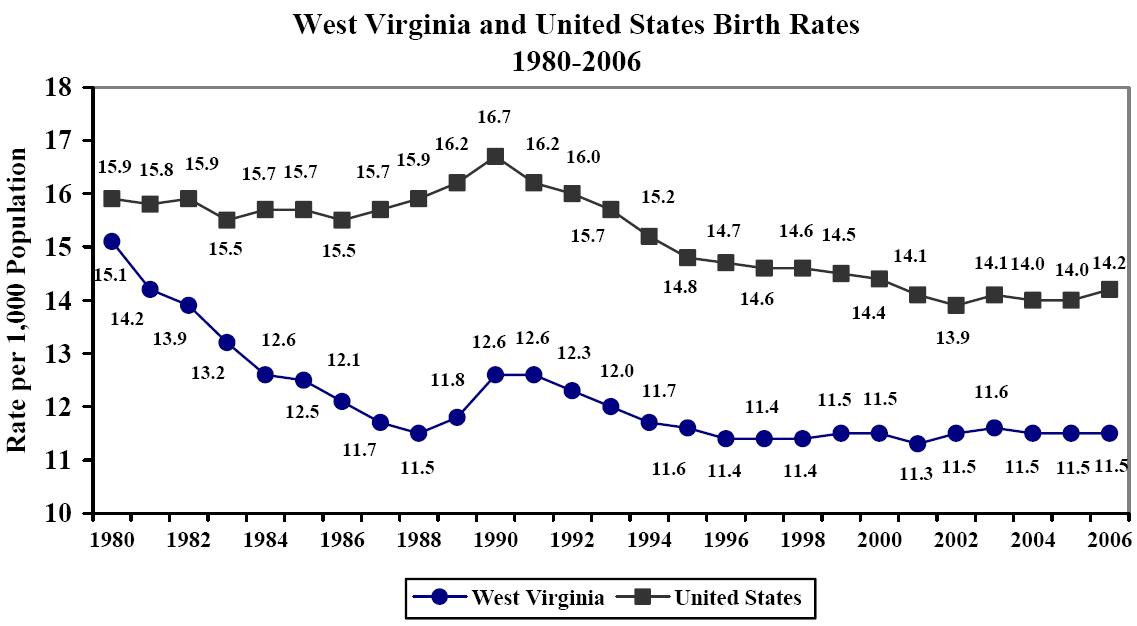
West Virginias resident live births increased by 97, from 20,834 in 2005 to 20,931 in 2006. The 2006
birth rate of 11.5 per 1,000 population was the same as the 2005 rate. The U.S. 2006 birth rate was
14.2 live births per 1,000 population rising above the 2005 rate of 14.0. As the graph below shows,
West Virginias birth rate has been below the national rate since 1980. It continued its overall
decline until 1996, interrupted by slight upturns in 1989 through 1991. It has remained relatively
stable since 1996.
The 2006 U.S. fertility rate of 68.5 live births per 1,000 women aged 15-44 was 2.7% higher than the 2005 rate (66.7). West Virginias fertility rate increased 0.9%, from 58.8 in 2005 to 59.3 in 2006. A comparison of West Virginia and United States age-specific fertility rates is displayed below:
| Fertility Rates* by Age Group West Virginia and United States, 2006 |
|||||
|---|---|---|---|---|---|
| 15-19 | 20-44 | Total (15-44) | |||
| WV | U.S.** | WV | U.S.** | WV | U.S.** |
| 44.8 | 41.9 | 62.1 | 73.6 | 59.3 | 68.5 |
* All fertility rates were calculated using 2006 estimates. U.S. Department of Commerce, Bureau of the Census.
** National Center for Health Statistics,
http://www.cdc.gov/nchs/data/nvsr/nvsr56/nvsr56_07.pdf
The fertility rate among women aged 15-19 in West Virginia was 6.9% higher than that among young women in the U.S. (44.8 vs. 41.9). The fertility rate among women aged 20-44 was lower by 15.6% in the state than in the nation (62.1 vs. 73.6).
The number of births to teenage mothers (ages 10-19) increased by 130 (5.3%), from 2,472 in 2005 to 2,602 in 2006. The percentage of total births represented by teenage births also increased from 11.9% in 2005 to 12.4% in 2006. The significantly lower fertility rate among older women, however, resulted in teenage births continuing to constitute a higher proportion of total births than was found nationally (10.4% in 2006).
The percentage of births occurring out of wedlock continued to rise in 2006. Again, over one out of every three (37.8%) West Virginia resident births were to unwed mothers. The percentages of white and black births that occurred out of wedlock in West Virginia in 2006 were 36.7% and 73.5%, respectively, compared to 35.2% and 75.5% in 2005. In the United States in 2006, 26.6% of white births (non-Hispanic) and 70.7% of births to black mothers (non-Hispanic) occurred out of wedlock. The percentage of teenage births to unmarried teenage mothers in the state increased from 77.1% in 2005 to 78.1% in 2006.
There was a total of 2,020 low birthweight babies (those weighing less than 2,500 grams or 5½ pounds) born to West Virginia residents in 2006, 9.7% of all births. Of the 2,020 low birthweight infants, 1,367or 67.7% were preterm babies born before 37 weeks of gestation. (Of all 2006 resident births with a known gestational age, 12.4% were preterm babies.) Of the births with known birthweight, 9.5% of babies born to white mothers and 15.8% of babies born to black mothers were low birthweight. Nationally, 8.3% of all infants weighed less than 2,500 grams at birth in 2006; 7.3% of white infants and 14.0% of black infants were of low birthweight.
Eighty-two percent (81.5%) of 2006 West Virginia mothers with known prenatal care began their care during the first trimester of pregnancy, compared with 86.1% of mothers nationwide in 2005 (the latest data available). Among those with known prenatal care, 82.0% of white mothers began care during the first trimester; 68.4% of black mothers did so. (U.S. figures show that 86.7% of white mothers and 76.5% of black mothers had first trimester care.) No prenatal care was received by 0.7% of white mothers and by 1.8% of black mothers.
Over one-fourth (27.2%) of the 20,931 births in 2006 were to mothers who smoked during their pregnancies, while 0.3% of births were to women who used alcohol. National figures from 2005 show that 10.7% of women giving birth reported smoking during pregnancy; 0.8% used alcohol in 2004 (the latest data available). Among the state mothers who reported smoking during pregnancy, 14.6% of the babies born were low birthweight, compared with 7.8% among non-smoking mothers. Over one-third (35.1%) of 2006 state births were delivered by Cesarean section, compared with a 2005 national rate of 30.3%. One or more complications of labor and/or delivery were reported for 31.3% of deliveries in the state in 2006.
Top of PageDeaths
The number of West Virginia resident deaths decreased by 124, from 20,773 in 2005 to 20,649 in 2006. The state’s crude death rate was unchanged from 2005 at 11.4 per 1,000 population in 2006. The average age at death for West Virginians was 72.1 (68.4 for men and 75.7 for women), slightly lower than the 2005 average of 72.4 (68.9 for men and 75.8 for women). One hundred and thirty-two West Virginia residents who died in 2006 were age 100 or older. The oldest woman was 107 years old at the time of death, while the oldest man was 103 years old.
Heart disease, cancer, and chronic lower respiratory diseases, the three leading causes of death, accounted for 54.1% of West Virginia resident deaths in 2006. Compared with 2005, the number of state deaths due to heart disease decreased 4.1% while cancer deaths decreased only by one death. Chronic lower respiratory disease, which was the third leading cause for the sixth time in the past seven years, decreased 7.3%; while stroke mortality decreased 7.1%. Diabetes mellitus deaths decreased 1.8%, while the number of reported deaths due to pneumonia and influenza decreased 4.1%. Alzheimers disease, now the seventh leading cause of death in the Mountain State for the fourth year in a row, increased by seven deaths or 1.3%. Unintentional injury mortality was the fourth leading cause of death. The number of unintentional injury deaths rose by 107 (9.7%), from 1,098 in 2005 to 1,205 in 2005. Motor vehicle accident deaths increased by 31 (7.9%), from 391 in 2005 to 422 in 2006. Accidental poisoning deaths have been on the rise in West Virginia for the past five years, 156 in 2002, to 252 in 2003, 306 in 2004, 336 in 2005, and 407 in 2006. The vast majority of these deaths were due to both legal and illicit ingestion of prescription pharmaceuticals.
Unintentional injuries were the leading cause of death for ages one through 44 years. Motor vehicle accident fatalities remained the single leading cause of death for young adults aged 15 through 24, accounting for 37.7% of all deaths for this age group in 2006. West Virginias 2006 motor vehicle fatalities included six children under five years of age, compared with three in 2005. Accidental poisoning accounted for nearly one-fourth (24.0%) of all deaths in the age group of 25-34.
Suicides increased by 10, from 272 to 282 between 2005 and 2006. Male suicides increased by one or 0.4 %, from 224 in 2005 to 225 in 2006; the number of female suicides (57) increased by 9 or 18.8% from 2005. Over two-thirds (68.1%) of all suicide deaths were firearm related 71.6% of male suicides and 54.4% of female suicides. The average age of death for a suicide victim in 2006 was 47.1 years. While suicide was the 11th leading cause of death overall, it was the second leading cause of death for ages 15-34. The number of suicides among persons aged 19 and under was 14 in 2006, down from 16 in 2005.
Homicides increased by five, from 98 in 2005 to 103 in 2006. Sixty-seven (67) of the homicide victims were male, 36 were female. The average age at death for a homicide victim in 2006 was 41.2 years. There was only one homicide victim under the age of five in 2006, compared with six in 2005. Nearly sixty percent (59.2%) of 2006 homicide deaths were due to firearms.
Top of PageYears of Potential Life Lost (YPLL)
YPLL is a measure of mortality, calculated as the difference between age 75 (an average life span) and the age at death. Using YPLL before age 75, the sum of YPLL across all causes of death represents the total YPLL for all persons dying before the age of 75. A person dying at the age of 45 would therefore contribute 30 years to the total YPLL (75-45=30). YPLL is an important tool in emphasizing and evaluating causes of premature death.
The YPLL from all causes increased 2.3%, from 163,704 YPLL in 2005 to 167,481 in 2006. The four leading causes of YPLL in 2006 were malignant neoplasms (35,353 YPLL), diseases of the heart (24,810 YPLL), non-motor vehicle accidents (20,586 YPLL), and motor vehicle accidents (14,562 YPLL). Combined, these four causes accounted for over half (56.9%) of all years of potential life lost in 2006. In comparison to 2005, YPLL attributable to malignant neoplasms decreased from 21.9% to 21.1%. YPLL due to diseases of the heart decreased from 16.0% to 14.8% of the total, and YPLL due to non-motor vehicle accidents increased from 10.8% to 12.3%. The percentage of total YPLL due to motor vehicle crashes also increased, from 7.9% to 8.7%.
Top of PageInfant Deaths
Deaths of infants under one year of age dropped by 13, from 168 in 2005 to 155 in 2006. West Virginia’s infant mortality rate also decreased, from 8.1 per 1,000 live births in 2005 to 7.4 in 2006. The U.S. infant mortality was 6.9 in 2005 (the latest data available).
The following table shows the decline in the national and state infant mortality rates from 1950 through 2006.
1950-2006 Infant Mortality
West Virginia and United States
(Number and Rate per 1,000 Live Births)
| Year | West Virginia | United States |
|---|---|---|
| 1950 | 31.4 | 29.2 |
| 1955 | 27.1 | 26.4 |
| 1960 | 25.3 | 26.0 |
| 1965 | 27.1 | 24.5 |
| 1970 | 23.3 | 20.0 |
| 1975 | 18.3 | 16.1 |
| 1980 | 11.8 | 12.6 |
| 1985 | 10.7 | 10.6 |
| 1990 | 9.8 | 9.1 |
| 1995 | 7.6 | 7.5 |
| 2000 | 7.6 | 6.9 |
| 2001 | 7.3 | 6.9 |
| 2002 | 9.1 | 7.0 |
| 2003 | 7.3 | 6.9 |
| 2004 | 7.6 | 6.8 |
| 2005 | 8.1 | 6.9 |
| 2006 | 7.4 | N/A |
The state’s 2006 white infant mortality rate decreased from 7.9 in 2005 to 6.8, while the rate for black infants increased from 15.8 to 29.2 (see Statistical Variation on page 9). West Virginias 2006 race-specific infant mortality rates and comparable 2005 U.S. rates are shown in the following table.
2006 West Virginia and 2005 United States
Infant Mortality by Race
(Number and Rate per 1,000 Live Births)
| Race of Infant | West Virginia | United States | ||
|---|---|---|---|---|
| Number | Rate | Number | Rate | |
| All Races | 155 | 7.4 | 28,440 | 6.9 |
| White | 135 | 6.8 | 18,514 | 5.7 |
| Black | 20 | 29.2 | 8,695 | 13.7 |
| Other | 0 | 0.0 | 1,231 | 4.5 |
Nearly three out of 10 (29.7%) infant deaths in 2006 were due to SIDS (sudden infant death syndrome). Approximately one in six (16.1%) were the result of congenital malformations, while 40.0% were due to certain conditions originating in the perinatal period, including disorders relating to short gestation and unspecified low birthweight (9.7%).
Top of PageNeonatal/Postneonatal Deaths
The number of neonatal deaths dropped by 25, from 106 in 2005 to 81 in 2006; the neonatal death rate also decreased, from 5.1 deaths among infants under 28 days per 1,000 live births in 2005 to 3.9 in 2006. Neonatal deaths comprised 52.3% of all West Virginia resident infant deaths in 2006, compared with 63.1% in 2005. The rate of postneonatal deaths increased from 3.0 deaths per 1,000 neonatal survivors in 2005 to 3.5 in 2006. The 2005 U.S. neonatal death rate was 4.5, while the postneonatal rate was 2.3 deaths per 1,000 neonatal survivors. U.S. neonatal and postneonatal data for 2006 were not available at the time of this publication.
Top of PageFetal Deaths
The 120 resident fetal deaths occurring after 20 or more weeks of gestation reported in 2006 were five more than in 2005 (115). The fetal death ratio also increased, from 5.5 deaths per 1,000 live births in 2005 to 5.7 in 2006. The majority (91.7%) of fetal deaths were due to conditions originating in the perinatal period, including complications of placenta, cord, and membrane (35.0%), maternal conditions (1.7%), maternal complications (13.3%), short gestation and low birthweight (6.7%), and other ill-defined perinatal conditions (27.5%). Congenital anomalies accounted for 8.3% of all fetal deaths.
Top of PageMarriages
For the sixth year in a row, the number of marriages in West Virginia decreased, from 13,423 in 2005 to 13,276 in 2006. The marriage rate in 2006 was 7.3 per 1,000 population, down from 7.4 in 2005. The 2006 U.S. provisional rate was 7.2.
For all marriages in 2006, the median age was 26 for brides and 29 for grooms. For first marriages, the median age for brides was 22; for grooms it was 24. The mode (most frequently reported age) for all marriages was 23 for brides and 25 for grooms, while for first marriages the mode was 22 for brides and 23 for grooms.
Top of PageDivorces and Annulments
The number of divorces and annulments decreased by 78 or 0.8%, from 9,269 in 2005 to 9,191 in 2006. The 2006 rate of 5.1 per 1,000 population was the same as the 2005 rate.
Of the 9,191 divorces in West Virginia in 2006, the median duration of marriage was six years. Over half (53.4%) of the divorces involved no children under 18 years of age in the family, while one child was involved in 22.8% of all divorces and two children were involved in 18.1%. Six divorces involved six or more children.
Top of PageInduced Termination of Pregnancy (ITOP)
The annual reporting of induced termination of pregnancy (ITOP), also properly referred to as induced abortion, was mandated in the latest revision of the West Virginia Code. An ITOP is a purposeful interruption of an intrauterine pregnancy with the intention other than to produce a live-born infant and which does not result in a live birth. The management of prolonged retention of products of conception following fetal death is excluded. The major distinguishing feature of this event is the fact that it is purposeful rather than spontaneous. A spontaneous interruption of a pregnancy is also known as a fetal death or a spontaneous abortion or, more commonly, as a miscarriage or a stillbirth.
One of the primary differences between the reporting of ITOP data and birth and death statistics is that ITOP statistics reflect events that occurred in West Virginia. Due to long standing interjurisdictional exchange agreements with other states, births and deaths to West Virginia residents that occur elsewhere are reported back to West Virginia, making it possible to ascertain the number of births and deaths among West Virginia residents in a given time frame regardless as to where the event occurred. Information on the number of West Virginia residents who obtain an ITOP in another state is infrequently reported back to West Virginia by the state where the procedure took place, normally due to restrictions within the other states legal code.
The only two free-standing clinics that perform ITOPs on demand in West Virginia are in Charleston, which makes the likelihood of out-of-state ITOPs greater in some regions of the state. It is unlikely that the majority of women living in the northern and eastern panhandles of the state seek an ITOP in West Virginia. Due to known incomplete reporting, therefore, the procedures performed on West Virginia residents in other states have been excluded from the compiled statistics.
In 2006, there were 2,037 ITOPs performed in West Virginia, 21.7% more than in 2005 (1,674). Nearly nine out of every ten (89.7%) 2006 ITOPs involved a West Virginia resident, while 5.4% were Ohio residents and 3.8% were residents of Kentucky, compared with 2005 percentages of 86.6%, 7.0%, and 5.6%, respectively. The median age of women having an ITOP in 2006 was 24, the same as in 2005. There were 108 procedures in 2006 involving females under the age of 18, of which 100 were to unemancipated minors (see Definitions), compared with 105 in 2005, of which 96 were unemancipated minors.
Top of PageDeclaration of Paternity Affidavit
A declaration of paternity affidavit, commonly called a paternity affidavit or a paternity acknowledgment, is a legal instrument signed by both parents in which both attest to the paternity of their child. In most situations, paternity affidavits are used when the mother was unmarried at the time of conception or birth. It is unlawful to file a certificate of live birth with a father for a birth to a woman who was unmarried at the time of conception or birth without having first received an acceptable declaration of paternity affidavit or an order from a court of competent jurisdiction. Under WV State Code and, generally, nationwide, the husband of a woman at the time of the conception or birth of her child is presumed to be the legal father of the child. Until July of 2006, the birth certificate for a child born in wedlock could only bear the name of the mothers husband unless there was a court order that specified otherwise. In July 2006, an administrative procedure was put in place to allow a mother, her husband, and a putative father to attest that the husband was not the father and that the putative father was the biological father. This three-way paternity process is in use in over half of the states in the nation.
There were 21,137 babies born in West Virginia during 2006 (see differences between residence and occurrence in Methodology). Of those, 8,236 or 39.0% were born to unmarried mothers, compared with 37.7% in 2005. A father was established through a paternity affidavit in 5,382 or 65.3% of the unmarried births (25.5% of all occurrence births) in 2006, compared with 65.3% of unmarried births or 24.6% of all births in 2005.
Top of PageSummary
The number of West Virginia resident births increased by 97 from 20,834 in 2005 to 20,931 in 2006. West Virginia resident deaths only decreased by 124 (20,773 in 2005 to 20,649) in 2005. The number of infant deaths dropped by 13, from 168 in 2005 to 155 in 2006. Fetal deaths of 20 or more weeks gestation increased from 115 in 2005 to 120 in 2006. Marriages decreased for the sixth time in eight years, from 13,423 in 2005 to 13,276 in 2006, while divorces decreased from 9,269 in 2005 to 9,191 in 2006. Abortions in West Virginia rose from 1,674 in 2005 to 2,037 in 2006. A father was established through a paternity affidavit in 5,382 (or 25.5%) of the births occurring in West Virginia.
This is only the second year for which data on induced termination of pregnancy and paternity affidavits have been included in this annual publication. However, these data are available for prior years by specific request.