 Executive Summary Table of Contents A National Burden The West Virginia Problem Appendixes |
II. Chronic Lower Respiratory Disease:
|
||||||||||||||||||||||||||||||||||||||||||||||||||||||||||||||||||||||||||||||||||||||||||||||||||||||||||||||||||||||||||||||||||||||||||||||||||||||||||||||||||||||||||||||||||||||||||||||||||||||||||||||||||||||||||||||||||||||||||||||||||||||||||||||||||||||||||||||||||||||||||||||||||||||||||||||||||||||||||||||||||||||||||||||||||||||||||||||||||||||||||||||||||||||||||||||||||||||||||||||||||||||||||||||||||||||||||||||||||||||||||||||||||||||||||||||||||||||||||||||||||||||||||||||||||||||||||||||||||||||||||||||||||||||||||||||||||||||||||||||||||||||||||||||||||||||||||||||||||||||||||||||||||||||||||||||||||||||||||||||||||||||||||||||||||||||||||||||||||||||||||||||||||||||||||||||||||||||||||||||||||||||||||||||||||||||||||||||||||||||||||||||||||||||||||||||||||||||||||||||||||||||||||||||||||||||||||||||||||||||||||||||||||||||||||||||||||||||||||||||||||||||||||||||||||||||||||||||||||||||||||||||||||||||||||||||||||||||||||||||||||||||||||||||||||||||||||||||||||||||
| Table 1. Prevalence of Lifetime and Current Asthma among Adults by Selected Demographics 2001 West Virginia Behavioral Risk Factor Surveillance System |
|||||
|---|---|---|---|---|---|
Demographic |
Lifetime Asthma | Current Asthma | |||
| Prevalence (%) |
(95% CI) | Prevalence (%) |
(95% CI) | ||
| Total | 12.5 | (11.2, 13.8) | 9.3 | (8.2, 10.4) | |
| Sex | |||||
| Male | 10.8 | (8.9, 12.8) | 7.4 | (5.7, 9.0) | |
| Female | 13.9 | (12.2, 15.7) | 11.0 | (9.4, 12.6) | |
| Age | |||||
| 18-24 | 18.9 | (13.5, 24.3) | 12.9 | (8.3, 17.5) | |
| 25-34 | 11.6 | (8.7, 14.5) | 7.9 | (5.5, 10.3) | |
| 35-44 | 11.7 | (9.1, 14.3) | 8.8 | (6.5, 11.1) | |
| 45-54 | 12.9 | (10.3, 15.5) | 10.4 | (8.0, 12.8) | |
| 55-64 | 10.3 | (7.4, 13.2) | 8.1 | (5.5, 10.7) | |
| 65+ | 11.2 | (8.8, 13.4) | 8.6 | (6.6, 10.6) | |
| Educational Level | |||||
| <12 Years | 15.5 | (12.6, 18.4) | 12.8 | (10.1, 15.5) | |
| 12 Years | 12.6 | (10.8, 14.4) | 9.4 | (7.8, 11.0) | |
| 13-15 Years | 12.0 | (9.6, 14.4) | 8.4 | (6.3, 10.5) | |
| 16+ Years | 9.5 | (7.0, 12.0) | 6.3 | (4.2, 8.4) | |
| Household Income | |||||
| <$15,000 | 17.6 | (14.2, 21.0) | 14.2 | (11.1, 17.3) | |
| $15,000-$24,999 | 14.8 | (12.2, 17.4) | 10.6 | (8.3, 12.9) | |
| $25,000-$49,999 | 10.4 | (8.4, 12.4) | 7.4 | (5.7, 9.1) | |
| $50,000+ | 8.3 | (6.1, 10.5) | 5.9 | (4.0, 7.8) | |
| Table 2. Asthma-Related Prevalences among West Virginia Students 2002 West Virginia Youth Tobacco Survey |
|||||
|---|---|---|---|---|---|
| Middle Schools | High Schools | ||||
| (%) | (95% CI) | (%) | (95% CI) | ||
| Lifetime Asthma | |||||
| Total | 23.2 | (22.0, 24.4) | 21.1 | (18.1, 24.1) | |
| Males | 24.2 | (22.5, 25.8) | 21.4 | (17.8, 25.0) | |
| Females | 22.0 | 20.5, 23.5) | 21.0 | (17.5, 24.5) | |
| Current Asthma | |||||
| Total | NA | -- | 12.4 | (9.5, 15.3) | |
| Males | NA | -- | 11.7 | (8.4, 15.0) | |
| Females | NA | -- | 13.2 | (10.0, 16.4) | |
| Asthma Attack in Past Year | |||||
| Total | 10.3 | (9.7, 10.9) | 8.8 | (6.9, 10.7) | |
| Males | 10.6 | (9.7, 11.4) | 7.8 | (5.4, 10.3) | |
| Females | 10.0 | (9.0, 11.0) | 9.8 | (7.9, 11.8) | |
| Currently Taking Prescription Medicine for Asthma | |||||
| Total | 10.5 | (9.8, 11.2) | 7.3 | (5.1, 9.5) | |
| Males | 10.5 | (9.5, 11.5) | 8.2 | (5.4, 10.9) | |
| Females | 10.3 | (9.1, 11.6) | 6.5 | (4.4, 8.6) | |
Cigarette Smoking Prevalence
As discussed earlier (see page 6), cigarette smoking is the most important risk factor for the development of chronic bronchitis and emphysema and a major trigger for asthma attacks. The prevalence of cigarette smoking among West Virginians, both adults and youth, is high and corresponds with the high rates of CLRD prevalence, mortality, and hospitalization in the state.
Adult Smoking. In 2001, 28.2% of West Virginia adults self-reported being current cigarette smokers, the 4th highest rate among the 54 BRFSS participants in that year. Little difference was noted between the sexes; 28.9% of men and 27.6% of women reported current smoking. As shown in Table 3, smoking prevalence decreases with age, educational level, and household income.
Former smoking is also a risk factor for chronic lower respiratory diseases. The prevalence of former smokers in 2001 was 24.7% (no rank available). Thirty percent (30.4%) of men and 19.6% of women reported having smoked at one time in their lives, a statistically significant difference. The percentage of former smokers increases with age, but no pattern is evident for education or income.
| Table 3. Prevalence of Current/Former Cigarette Smoking among Adults by Selected Demographics 2001 West Virginia Behavioral Risk Factor Surveillance System |
|||||
|---|---|---|---|---|---|
Demographic |
Current Smoking* | Former Smoking | |||
| Prevalence (%) |
(95% CI) | Prevalence (%) |
(95% CI) | ||
| Total | 28.2 | (26.4, 30.0) | 24.7 | (23.1, 26.4) | |
| Sex | |||||
| Male | 28.9 | (26.1, 31.8) | 30.4 | (27.7, 33.3) | |
| Female | 27.6 | (25.3, 29.9) | 19.6 | (17.7, 21.6) | |
| Age | |||||
| 18-24 | 41.1 | (33.9, 48.7) | 11.0 | (7.1, 16.7) | |
| 25-34 | 35.0 | (30.5, 39.8) | 15.1 | (11.9, 18.9) | |
| 35-44 | 35.4 | (31.4, 39.7) | 18.3 | (15.2, 22.0) | |
| 45-54 | 28.1 | (24.5, 32.0) | 27.2 | 23.5, 31.2) | |
| 55-64 | 23.7 | (19.6, 28.3) | 37.0 | (32.1, 42.1) | |
| 65+ | 11.2 | (8.9, 14.0) | 36.7 | (33.0, 40.5) | |
| Educational Level | |||||
| <12 Years | 33.6 | (29.4, 38.1) | 27.1 | (23.4, 31.2) | |
| 12 Years | 30.7 | (27.9, 33.6) | 24.6 | (22.1, 27.3) | |
| 13-15 Years | 28.0 | (24.3, 32.0) | 25.1 | (21.7, 28.9) | |
| 16+ Years | 15.9 | (12.8, 19.6) | 21.7 | (18.2, 25.7) | |
| Household Income | |||||
| <$15,000 | 35.4 | (30.8, 40.3) | 21.5 | (17.8, 25.7) | |
| $15,000-$24,999 | 33.5 | (29.6, 37.6) | 28.1 | (24.6, 32.0) | |
| $25,000-$49,999 | 27.3 | (23.9, 32.2) | 24.6 | (20.5, 29.1) | |
| $50,000+ | 19.3 | (14.9, 24.9) | 24.4 | (19.4, 30.2) | |
*Have smoked at least 100 cigarettes in their lives and still smoke. |
|||||
When the percentages of current smokers and former smokers are combined, it is apparent why this behavior and CLRD constitute such a serious problem in West Virginia. In 2001, 52.9% of all West Virginia adults smoked or had smoked. Nearly six out of every 10 men (59.3%) and 47.2% of all women were either current or former smokers.
Youth Smoking. Data on youth smoking were obtained from the 2002 WVYTS. Two categories of cigarette smoking self-reported by students are presented in Table 4: current smokers and frequent smokers.
Sixteen percent (16.3%) of middle school students reported being current smokers, i.e., had smoked cigarettes on one or more of the past 30 days. Among high school students, 33.7% of students reported current smoking. Five percent (5.4%) of middle school students and 18.7% of high school students were frequent smokers, i.e., had smoked cigarettes on 20+ days of the past 30 days. No significant differences were found in either category between male and female students.
The overwhelming majority of high school students17 strongly agreed that tobacco use increases a persons chances of getting lung cancer or other serious diseases, with females significantly more likely to strongly agree than males. Over half of all current smokers in both the middle schools and high schools had attempted to quit at some time during the past 12 months. Fifty-seven percent (56.7%) of current smokers in middle schools had tried to quit, as had 57.9% of current smokers in high school, with no significant differences between the sexes in either category.
Research shows that secondhand smoke is directly associated with lower respiratory diseases (see page 7). The students surveyed by the WVYTS were asked about their exposure to someone elses cigarette smoke. Seventy-three percent (73.2%) of middle school students and 82.9% of high school students reported having been in the same room or in a car with someone who was smoking within the past seven days. Interestingly, middle school girls were significantly more likely to have had secondhand smoke exposure than were the boys; no significant difference was found among high school students.
| Table 4. Prevalence of Current and Frequent Cigarette Smoking, Quit Attempts, and Exposure to Secondhand Smoke among Middle and High School Students 2002 West Virginia Youth Tobacco Survey |
|||||||
|---|---|---|---|---|---|---|---|
| Middle Schools | High Schools | ||||||
| Male % (95% CI) |
Female % (95% CI) |
Total % (95% CI) |
Male % (95% CI) |
Female % (95% CI) |
Total % (95% CI) |
||
| Current Smoking | 15.8 (13.8, 17.8) |
16.6 (14.3, 18.9) |
16.3 (14.3, 18.3) |
33.3 (29.4, 37.2) |
34.1 (29.4, 38.8) |
33.7 (30.6, 36.8) |
|
| Frequent Smoking | 5.4 (4.2, 6.6) |
5.3 (4.2, 6.4) |
5.4 (4.5, 6.3) |
19.6 (16.0, 23.2) |
17.9 (13.7, 22.1) |
18.7 (15.4, 22.0) |
|
| Strongly Agree that Using Tobacco Increases Chances of Getting a Serious Disease | NA | NA | NA | 73.6 (69.2, 78.0) |
85.1 (81.5, 88.7) |
79.1 (75.5, 82.7) |
|
| Current Smokers Who Have Attempted to Quit | 54.4 (49.6, 59.4) |
59.0 (55.9, 62.1) |
56.7 (54.3, 59.1) |
55.9 (48.5, 63.3) |
60.1 (54.0, 66.2) |
57.9 53.4, 62.4) |
|
| Exposure to Secondhand Smoke | 70.6 (67.9, 73.3) |
75.9 (74.0, 77.8) |
73.2 (71.0, 75.4) |
81.2) (77.7, 84.7) |
84.7 (81.9, 87.5) |
82.9 (80.4, 85.4) |
|
Chronic Lower Respiratory Disease Hospitalizations
West Virginia and United States, 2000. Hospitalization data provide important information on the burden of specific conditions on a population, both in terms of human suffering and financial cost. Data were obtained from the West Virginia Health Care Authority (WVHCA)18 (74) to estimate COPD and asthma inpatient hospitalizations among state residents and related costs during 2000. United States data presented for comparison purposes were obtained from the 2000 National Hospital Discharge Survey (75). All data are presented for COPD or asthma as a first-listed diagnosis only.
Table 5 compares the rate of hospital discharges and average length of stay (ALOS) for patients with a first-listed diagnosis of either chronic bronchitis or asthma for the United States and West Virginia for 2000 (data on emphysema were not available for comparison with the U.S.). The rates of hospitalization due to chronic bronchitis were markedly higher for West Virginians than their national counterparts for both sexes and among all age groups. The overall rate of 54.2 discharges per 10,000 population was over three times the U.S. rate of 17.6. The ALOS for a chronic bronchitis hospitalization in West Virginia was similar to that in the U.S. as a whole.
The rates of asthma hospitalizations in 2000 were lower in the state than in the nation. The states total rate of 12.9 was about 23% lower than the U.S. rate of 16.7. The ALOS for an asthma hospitalization in West Virginia was slightly higher than that in the U.S., 3.5 days compared with 3.0 days.
| Table 5. Rate of Hospital Discharges and Average Length of Stay (ALOS) for First-Listed Diagnoses of Chronic Bronchitis and Asthma by Gender and Age West Virginia and United States, 2000 |
|||||
|---|---|---|---|---|---|
| Rate of Discharge* | ALOS | ||||
| WV | US | WV | US | ||
| Chronic Bronchitis | |||||
| Total |
54.2 | 17.6 | 5.2 | 5.2 | |
| Male | 46.3 | 15.6 | 5.0 | 5.2 | |
| Female | 61.7 | 19.5 | 5.4 | 5.2 | |
| <15 | ** | ** | ** | ** | |
| 15-44 | 6.1 | 1.4 | 4.0 | 4.6 | |
| 45-64 | 67.3 | 23.7 | 4.8 | 5.1 | |
| 65+ | 226.8 | 94.3 | 5.5 | 5.2 | |
| Asthma | |||||
| Total | 12.9 | 16.7 | 3.5 | 3.0 | |
| Male | 9.4 | 14.5 | 2.9 | 2.6 | |
| Female | 16.3 | 18.8 | 3.8 | 3.4 | |
| <15 | 24.2 | 33.6 | 2.3 | 2.2 | |
| 15-44 | 8.1 | 9.1 | 3.2 | 2.9 | |
| 45-64 | 11.5 | 13.7 | 4.2 | 3.9 | |
| 65+ | 14.9 | 19.6 | 5.2 | 4.9 | |
| *Rate per 10,000 population **Number too small to meet standard of reliability |
|||||
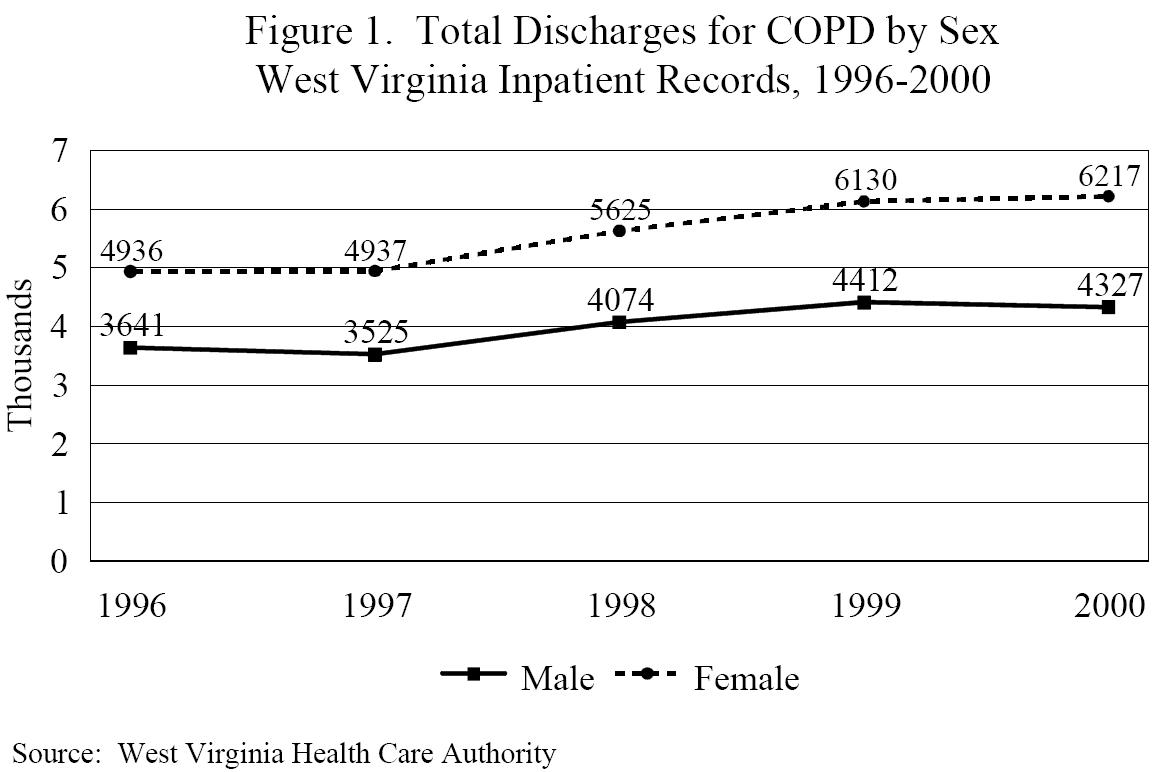
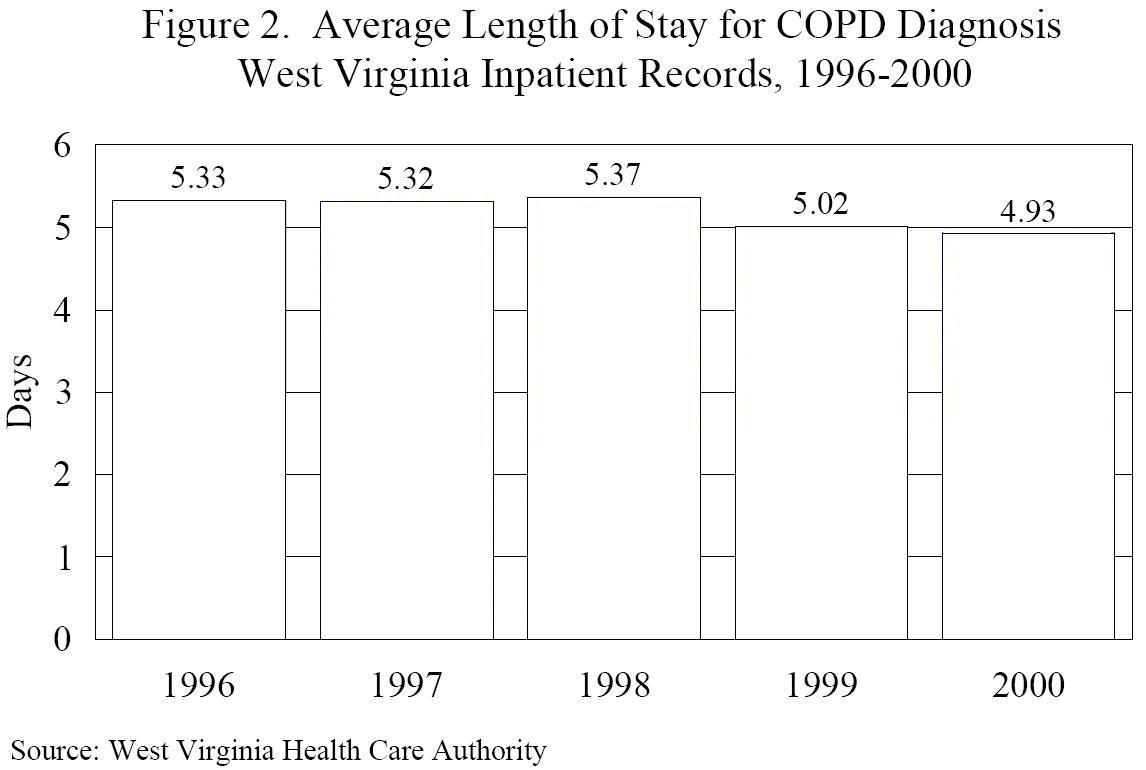
West Virginia, 1996-2000. Looking strictly at West Virginia data, in 2000 there were 10,544 hospital discharges having COPD as the first-listed diagnosis,19 6,217 among men and 4,327 among women (Figure 1). From 1996 to 2000, total COPD hospitalizations increased 23%, with increases seen among both sexes. While the number of hospitalizations has increased, the average length of stay for a patient with a COPD diagnosis has decreased by approximately a half day over the past five years (Figure 2). In 1996, the ALOS for a COPD diagnosis was 5.3 days, compared with an ALOS of 4.9 in 2000.
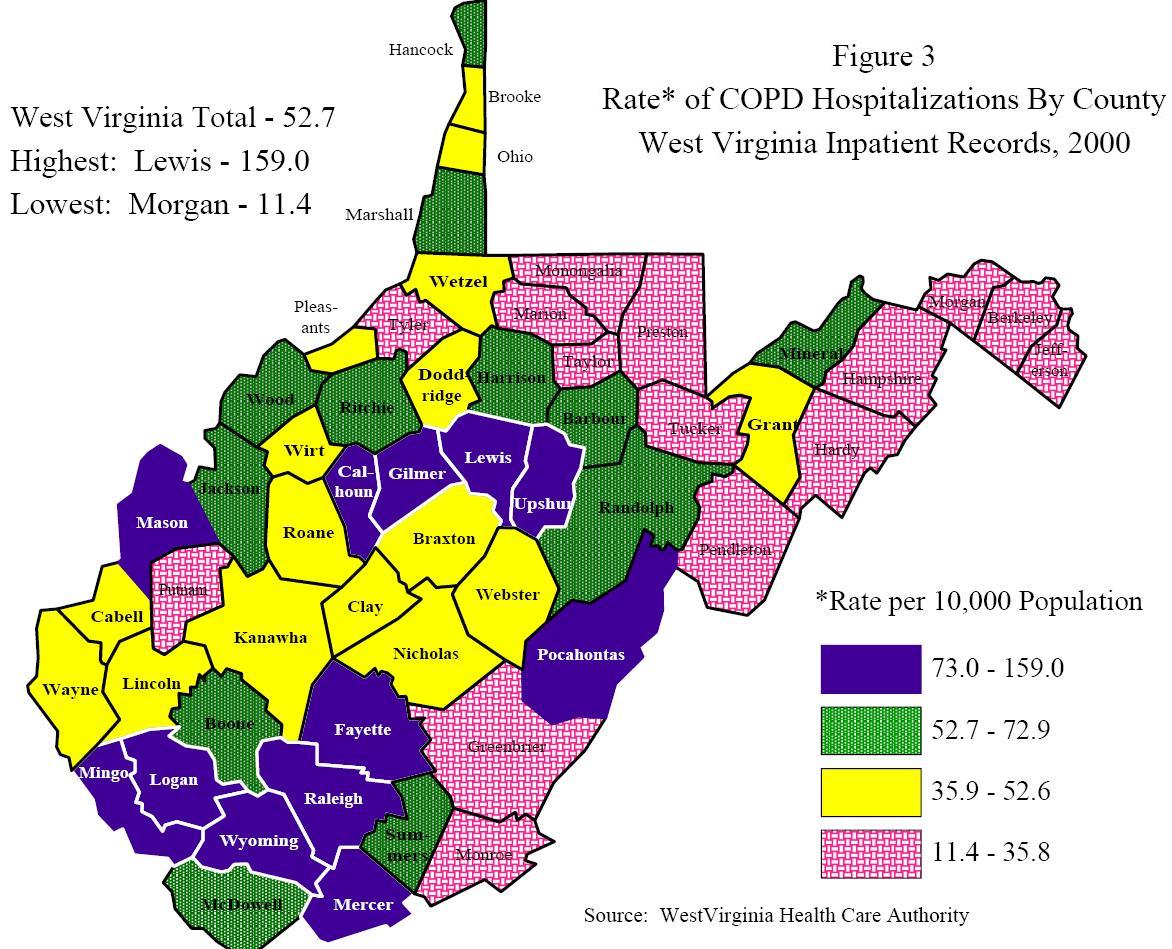
Rates of COPD hospitalization varied greatly around the state in 2000. Figure 3 illustrates these differences by county. The rates (hospitalizations per 10,000 population) ranged from a high of 159.0 in Lewis County to a low of 11.4 in Morgan County, with the highest rates clustered in the southern and central portions of the state. The state average in that year was 52.7. Individual county rates are found in Appendix A.
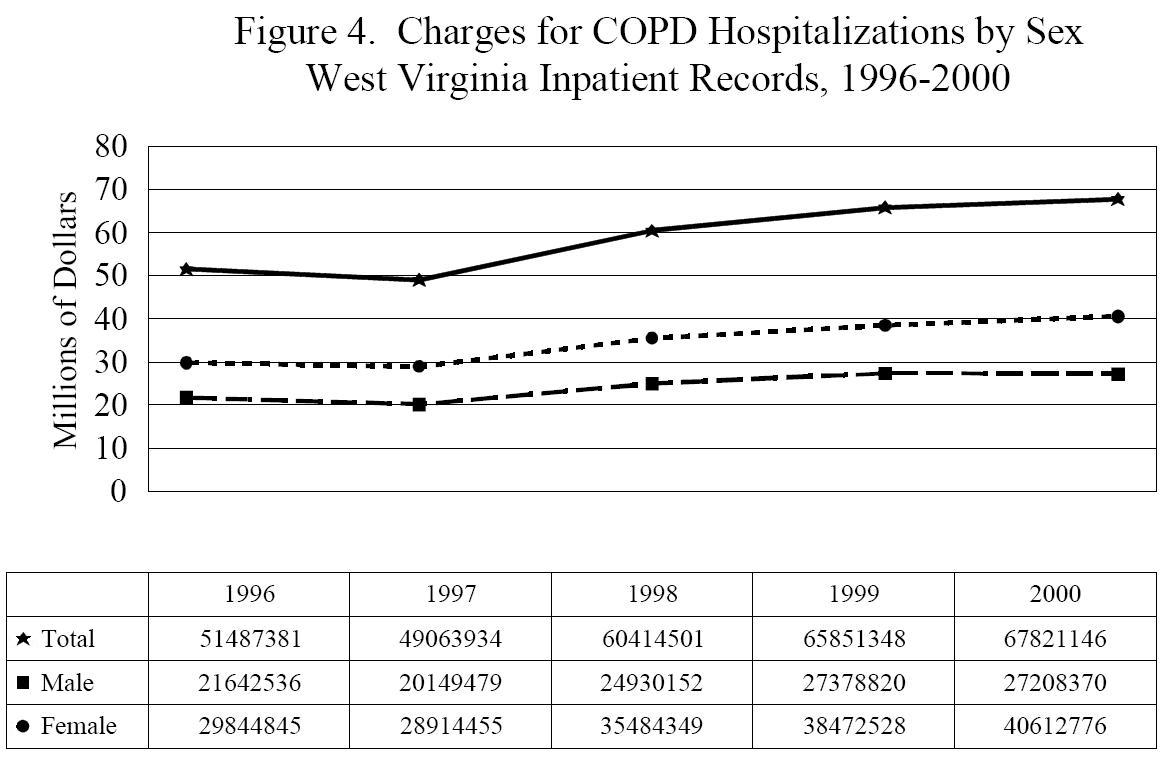
Total charges for COPD hospitalizations according to WVHCA inpatient records are presented in Figure 4. Overall charges increased 31.7% from 1996 to 2000, from $51,487,381 to $67,821,146. Charges among female COPD patients increased at a greater rate than those among male patients, 36.1% over the five-year period.
| 1996 | 1997 | 1998 | 1999 | 2000 | |
|---|---|---|---|---|---|
| 51487381 | 49063934 | 60414501 | 65851348 | 67821146 | |
| 21642536 | 20149479 | 24930152 | 27378820 | 27208370 | |
| 29844845 | 28914455 | 35484349 | 38472528 | 40612776 |
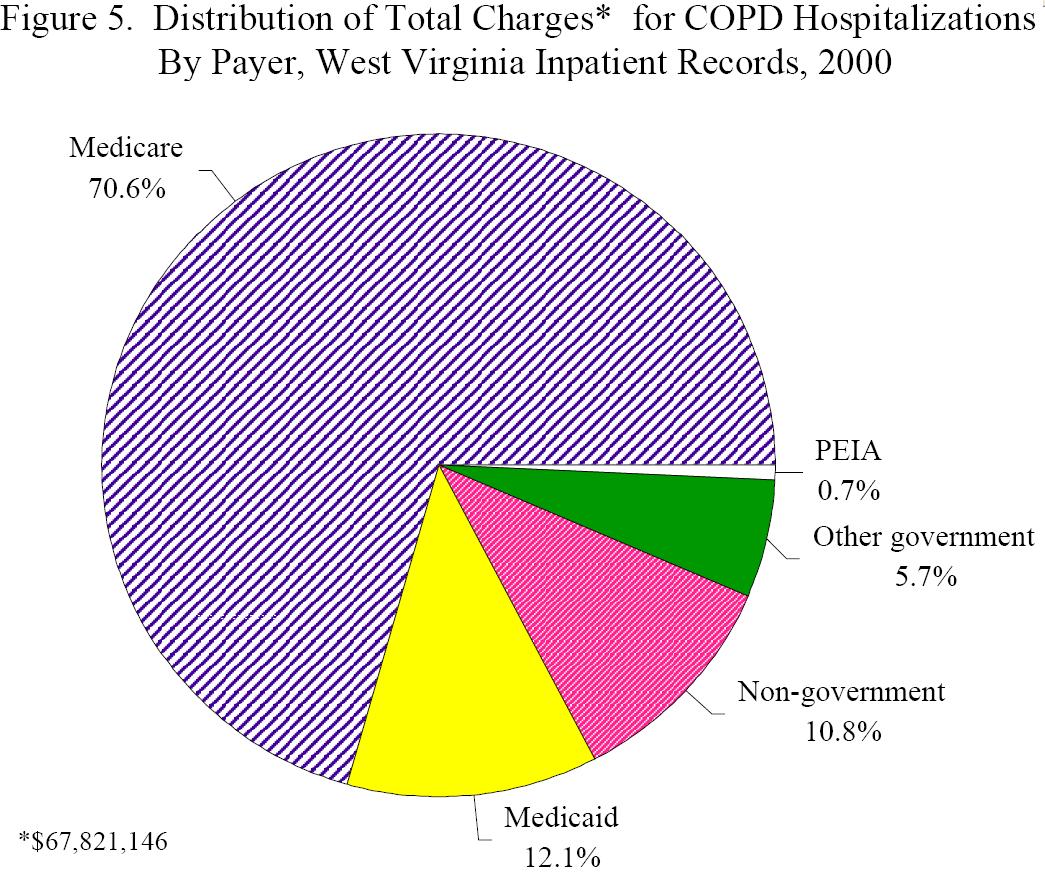
Table 6 presents the breakdown of total charges for COPD hospitalizations in 2000 by payer, as well as average charge, number of COPD-related discharges, and ALOS by payer. The bulk of the charges, $47,895,310 or over 70%, were billed to Medicare, not surprising since COPD develops over many years and primarily affects older persons. The next largest share of the costs were billed to Medicaid. Figure 5 illustrates the distribution of charges for COPD hospitalizations, showing the heavy burden on Medicare.
| Table 6. Selected Data on COPD Hospitalizations by Payer West Virginia Inpatient Records, 2000 |
|||||
|---|---|---|---|---|---|
| Payer | Discharges | Total Charges ($) |
Average Charge ($) |
Inpatient Days | ALOS |
| Medicare | 7,200 | 47,895,310 | 6,652 | 37,359 | 5.19 |
| Medicaid | 1,312 | 8,197,850 | 6,248 | 5,806 | 4.43 |
| Other Govt. | 639 | 3,888,478 | 6,085 | 2,878 | 4.50 |
| 94 |
485,804 |
5,168 |
392 |
4.17 |
|
| All Other | 1,299 | 7,353,704 | 5,661 | 5,589 | 4.30 |
Chronic Lower Respiratory Disease Mortality
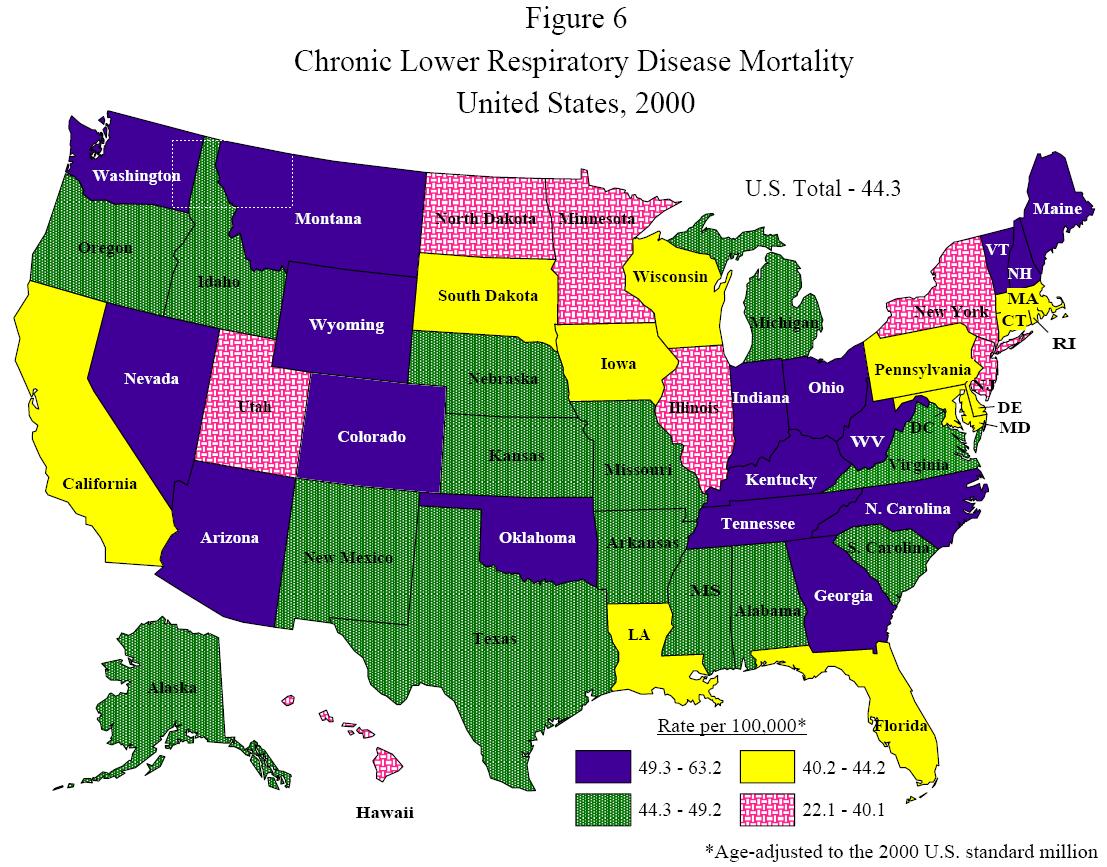
Since 2000, chronic lower respiratory disease has been the third leading cause of death in West Virginia. Only two other states, Nevada and Wyoming, currently share this distinction; CLRD is the fourth leading cause of death in all other states and the District of Columbia. In 2000, West Virginias age-adjusted20 CLRD mortality rate of 63.2 deaths per 100,000 population was the highest in the country; the national rate was 44.3 (Figure 6) (76). In that year, West Virginians comprised only 0.64% of the U.S. population but made up 1.1% of the nations total CLRD deaths. See Appendix B for individual state rates.
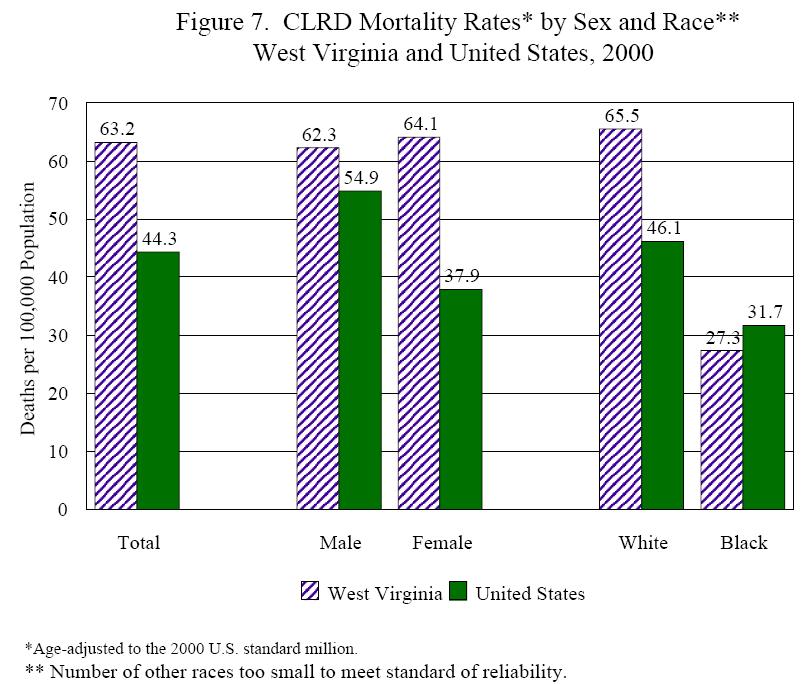
When examined by sex and race, in 2000 West Virginia residents had higher mortality rates due to CLRD in every group except African-Americans (Figure 7). While the overall state rate was 20% higher than the national rate, this difference was largely due to deaths among women. The state rate of 64.1 deaths per 100,000 population for women was 69% higher than that among women as a whole in the U.S. White residents had a mortality rate that was 42% higher than their counterparts nationwide. African-American residents, on the other hand, had a mortality rate that was 14% lower than the comparable national rate.
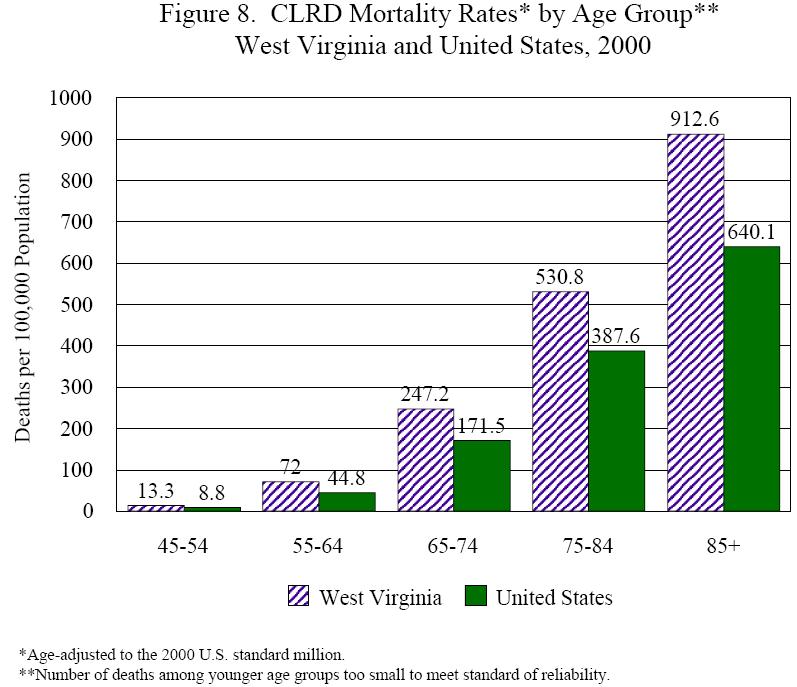
Analysis of mortality rates by age group showed that in 2000 West Virginians were more likely than their peers nationally to die from CLRD at all ages (Figure 8). The differences between West Virginia and U.S. rates ranged from a state rate 37% higher among persons aged 75-84 to a rate 61% higher among West Virginians aged 55-64.
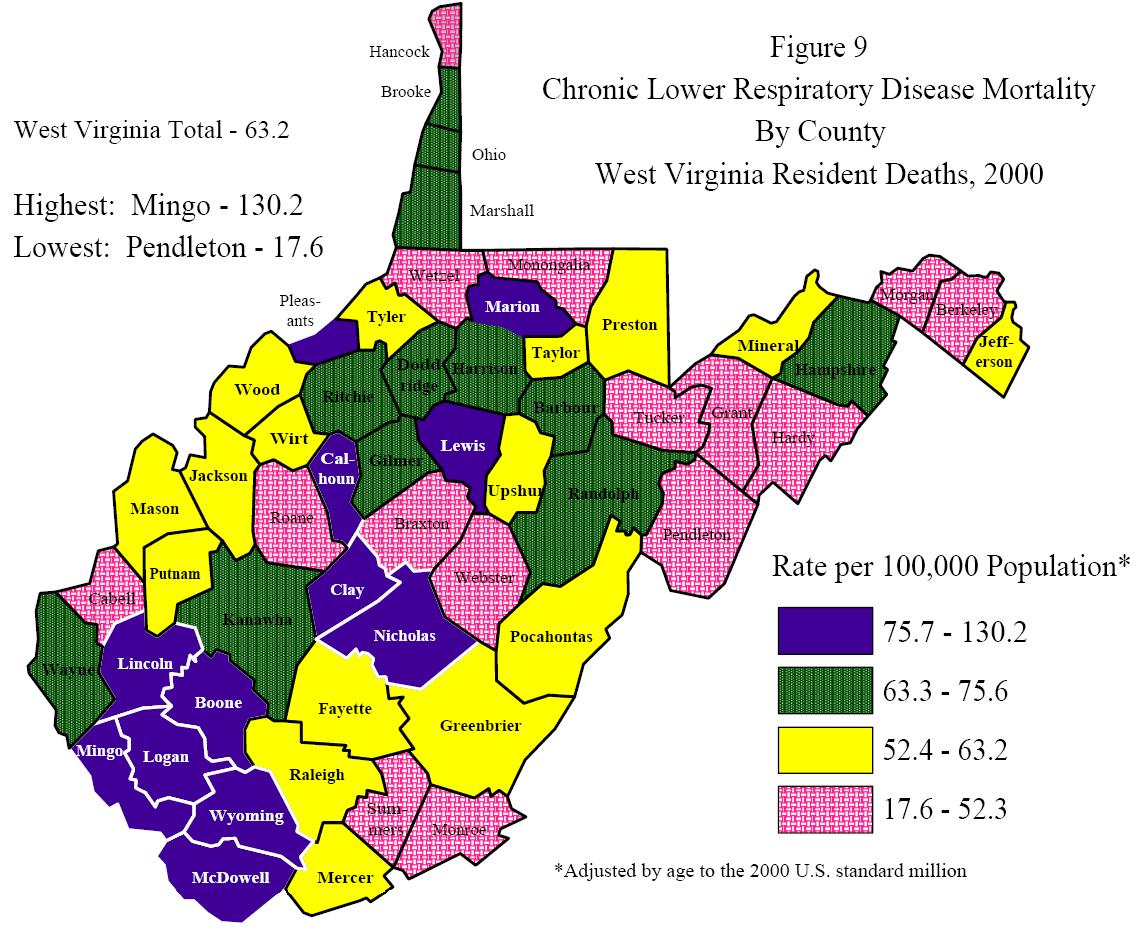
The highest rates of CLRD mortality in 2000 were primarily clustered among the southern and central counties of West Virginia, as Figure 9 illustrates. Rates ranged from a high of 130.2 deaths per 100,000 population in Mingo County to a low of 17.6 in Pendleton County. A complete list of county rates can be found in Appendix C.
| Age-Adjusted Mortality Rates* for Chronic Bronchitis by Sex West Virginia, 1982-2001 |
||||||||||||||||||||
| 1982 | 1983 | 1984 | 1985 | 1986 | 1987 | 1988 | 1989 | 1990 | 1991 | 1992 | 1993 | 1994 | 1995 | 1996 | 1997 | 1998 | 1999 | 2000 | 2001 | |
| 29.1 | 35.0 | 38.1 | 35.6 | 38.3 | 39.7 | 38.8 | 39.7 | 39.7 | 46.6 | 43.4 | 49.1 | 48.1 | 49.6 | 50.9 | 52.5 | 53.3 | 59.1 | 64.1 | 62.7 | |
| 45.8 | 56.1 | 57.3 | 55.6 | 56.0 | 61.5 | 56.1 | 57.1 | 57.3 | 65.4 | 61.2 | 65.5 | 65.6 | 68.6 | 68.2 | 66.3 | 70.0 | 78.1 | 79.7 | 77.9 | |
| 13.7 | 15.4 | 20.4 | 17.1 | 21.9 | 19.6 | 22.8 | 23.6 | 23.5 | 29.2 | 27.1 | 34.0 | 31.9 | 32.1 | 34.8 | 39.7 | 37.7 | 41.5 | 49.7 | 48.7 | |
| *Rate are deaths per 100,000 population, adjusted by age to the 2000 US standard million. | ||||||||||||||||||||
| Age-Adjusted Mortality Rates* for Emphysema by Sex West Virginia, 1982-2001 |
||||||||||||||||||||
| 1982 | 1983 | 1984 | 1985 | 1986 | 1987 | 1988 | 1989 | 1990 | 1991 | 1992 | 1993 | 1994 | 1995 | 1996 | 1997 | 1998 | 1999 | 2000 | 2001 | |
| 6.9 | 6.2 | 5.5 | 7.0 | 6.6 | 7.5 | 7.0 | 6.3 | 7.9 | 6.8 | 7.3 | 6.8 | 6.6 | 7.9 | 7.0 | 7.0 | 7.3 | 5.2 | 7.1 | 6.1 | |
| 10.6 | 9.5 | 8.0 | 10.4 | 8.7 | 10.5 | 10.4 | 8.5 | 11.2 | 9.7 | 9.6 | 8.6 | 8.6 | 9.5 | 9.2 | 7.9 | 9.1 | 6.8 | 8.2 | 7.6 | |
| 3.5 | 3.2 | 3.2 | 3.8 | 4.7 | 4.8 | 3.9 | 4.3 | 4.8 | 4.2 | 5.2 | 5.2 | 4.6 | 6.4 | 4.9 | 6.1 | 5.6 | 3.8 | 6.1 | 4.7 | |
| *Rate are deaths per 100,000 population, adjusted by age to the 2000 US standard million. | ||||||||||||||||||||
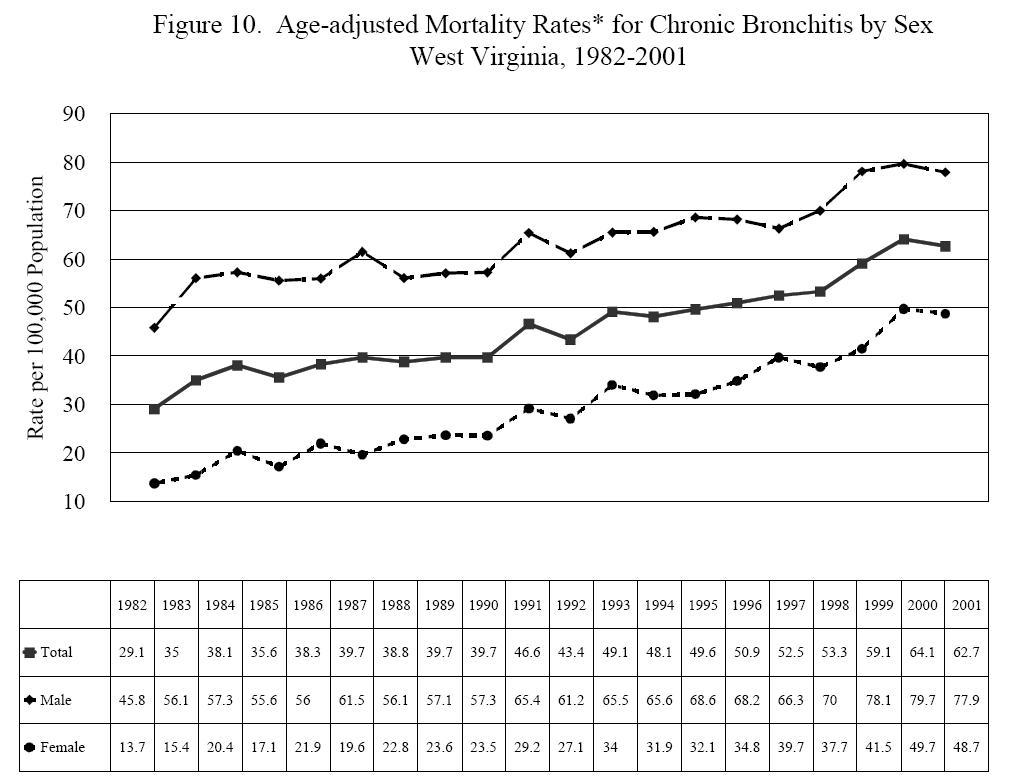
Chronic Bronchitis. From 1982 through 2001, West Virginias overall age-adjusted mortality rate for chronic bronchitis increased 116%, from 29.1 deaths per 100,000 population in 1982 to 62.7 in 2001 (Figure 10). While the rate among men rose 70% (45.8 to 77.9), that among the states women increased a staggering 256% (13.7 to 48.7), an annual average increase of 6.9%.
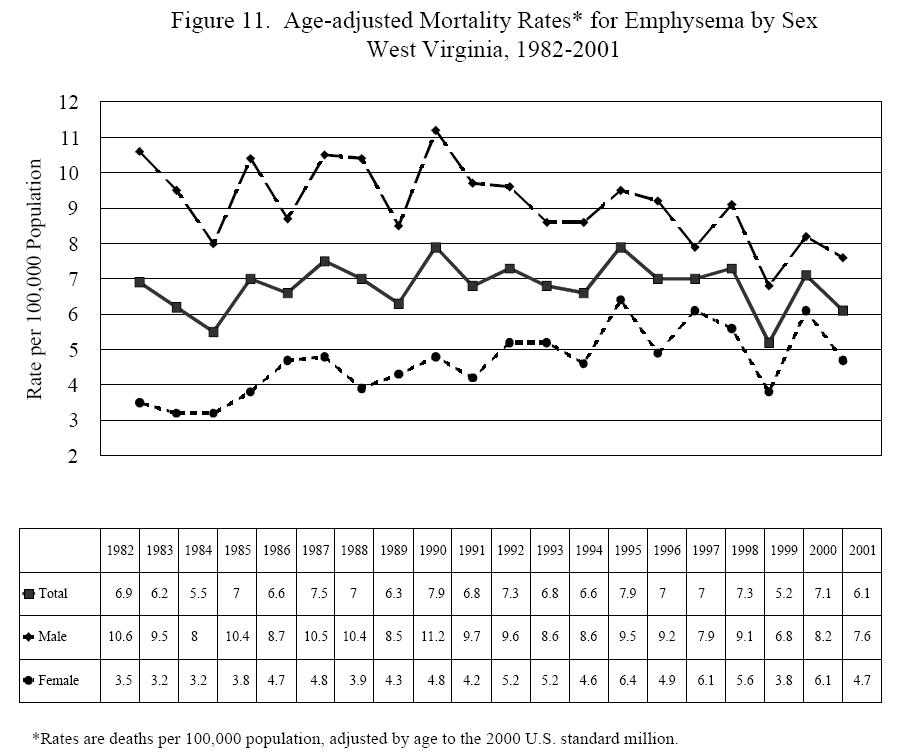
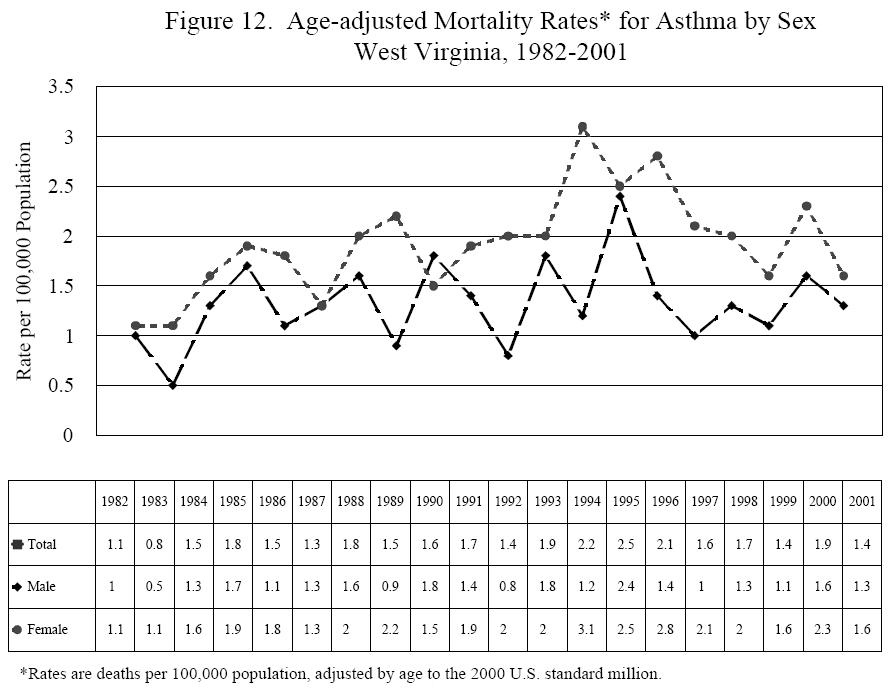
Emphysema. The overall age-adjusted mortality rate for emphysema decreased 12% between 1982 and 2001, from 6.9 deaths per 100,000 population to 6.1 (Figure 11). This decrease, however, was due entirely to the decline in deaths among men, from a rate of 10.6 in 1982 to 7.6 in 2001. Emphysema mortality rates among West Virginias women increased 34% over the time period, from 3.5 in 1982 to 4.7 in 2001, with rates as high as 6.1 in 1997 and 2000.Asthma. The overall death rate for asthma fluctuated between a low of 0.8 in 1983 and a high of 2.5 recorded in 1995 (Figure 12). With a few exceptions, the mortality rate among females was slightly higher than that among males over the 20-year period. Asthma deaths among females peaked in 1994 with a rate of 3.1.
| Age-Adjusted Mortality Rates* for Asthma by Sex West Virginia, 1982-2001 |
||||||||||||||||||||
| 1982 | 1983 | 1984 | 1985 | 1986 | 1987 | 1988 | 1989 | 1990 | 1991 | 1992 | 1993 | 1994 | 1995 | 1996 | 1997 | 1998 | 1999 | 2000 | 2001 | |
| 1.1 | 0.8 | 1.5 | 1.8 | 1.5 | 1.3 | 1.8 | 1.5 | 1.6 | 1.7 | 1.4 | 1.9 | 2.2 | 2.5 | 2.1 | 1.6 | 1.7 | 1.4 | 1.9 | 1.4 | |
| 1.0 | 0.5 | 1.3 | 1.7 | 1.1 | 1.3 | 1.6 | 0.9 | 1.8 | 1.4 | 0.8 | 1.8 | 1.2 | 2.4 | 1.4 | 1.0 | 1.3 | 1.1 | 1.6 | 1.3 | |
| 1.1 | 1.1 | 1.6 | 1.9 | 1.8 | 1.3 | 2.0 | 2.2 | 1.5 | 1.9 | 2.0 | 2.0 | 3.1 | 2.5 | 2.8 | 2.1 | 2.0 | 1.6 | 2.3 | 1.6 | |
| *Rate are deaths per 100,000 population, adjusted by age to the 2000 US standard million. | ||||||||||||||||||||
CLRD-Related Mortality. The National Center for Health Statistics releases annual multiple-cause-of-death tapes that include decedents age, sex, race, and state of residence; the underlying (primary) cause of death, and up to 19 contributing causes of death. This section examines multiple-cause-of-death data for West Virginia and the United States for 2000.
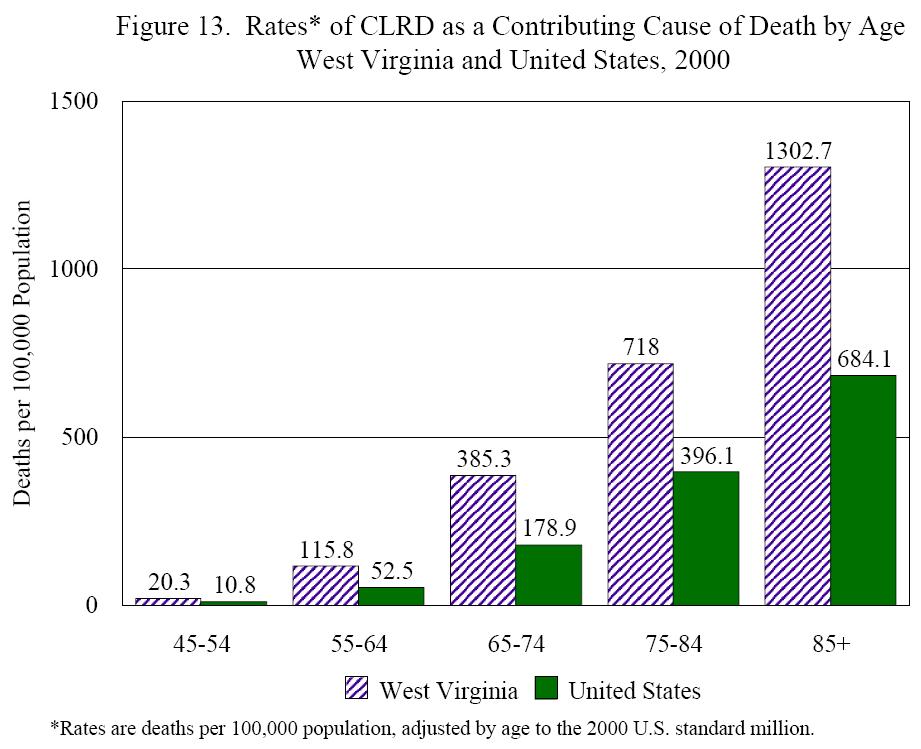
The age-adjusted rate for West Virginia for deaths with CLRD listed as a contributing cause was 91.3 (deaths per 100,000 population), compared with 45.9 for the United States as a whole. Excess West Virginia deaths were found among both males, with a state rate of 137.8 compared with 51.6 nationally, and females, 63.4 compared with 40.4. Although the mortality rate for CLRD as the underlying cause of death was lower among African-Americans in the state than their counterparts nationally in 2000 (see page 30), the reverse was found when examining CLRD as a contributory cause (79.7 vs. 27.3). The rate among white state residents was 92.5, compared with a rate of 55.9 among whites in the U.S. as a whole.
West Virginians of all ages were more likely to have CLRD listed as a contributing cause on their death certificates than their peers elsewhere (Figure 13). In terms of percentage differences between rates, the largest differences between state and national rates were found among 55-64 year olds (120.6% higher among West Virginians) and 65-74 year olds (115.4% higher).
Top of Page
Footnotes:
12The BRFSS is a monthly telephone survey established by the Centers for Disease Prevention and Control CDC) that allows states to monitor health behaviors among their adult populations (18+). The BRFSS was begun in 1984 with 15 participating states, expanding to 54 states and territories in 2001. Asthma prevalence has been monitored in all states since 2000.
13The WVYTS is conducted jointly by the West Virginia Department of Education, Office of Healthy Schools; the West Virginia Department of Health and Human Resources, Office of Epidemiology and Health Promotion; and the Office on Smoking and Health at the CDC. For more information on the survey, the reader is referred to 2002 West Virginia Youth Tobacco Survey, published in 2003 and available through the West Virginia Tobacco Prevention Program at (304) 558-1743.
14A comprehensive analysis of the states burden of asthma among both adults and adolescents is found in The Impact of Asthma in West Virginia, published by the West Virginia Bureau for Public Health in 2003 and available through the West Virginia Asthma Education and Prevention Program at (304) 558-0644..
15Answered yes to the question Have you ever been told by a doctor that you have asthma?
16Answered yes to the subsequent question Do you still have asthma?
17Middle school students were not asked this question.
18The WVHCA collects inpatient data from all nonfederal licensed hospitals in the state, as well as Medicare data on West Virginia residents hospitalized in out-of-state hospitals.
19Hospital discharges were still coded according to ICD-9 in 2000. Data for this section were obtained for the diagnosis related group (DRG) 88, COPD and Allied Conditions. DRG 88 includes chronic bronchitis, emphysema, and chronic asthma; it does not include acute bronchitis or acute asthma.
20Adjusted to the 2000 U.S. standard million.