 "2004 Vital" Executive SummaryTables Population
Other Information GraphicsMethodology Definitions Rates & Ratios ICD10 Groupings Statistics and Trivia - You must use the "BACK" button to return to this page. Other on-line HSC publications can be found at: PUBLICATIONS The Health
Statistics Center is located at:
|
West Virginia Vital Statistics - 2004
|
|||||||||||||||||||||||||||||||||||||||||||||||||||||||||||||||||||||||||||||||||||||||||||||||||||||||||||||||||||
| Population | Live Births | Deaths | YPLL | Infant Deaths | Neonatal/postneonatal deaths | Fetal Deaths | Marriages | Divorces and Annulments | Summary |
Population
Finally, more state residents were born than died after seven straight years. In 2004, 75 West Virginians were added to the total population as a result of natural increase, the excess of births over deaths. The rate of natural increase was 0.04 persons per 1,000 population. Results from the 2004 Census estimate show an overall increase (approximately 0.4%) in the states population since 2000, from 1,808,344 to 1,815,354. This increase is the result of a slight growth in the excess of in-migration over out-migration during that span.
Top of Page
Live Births
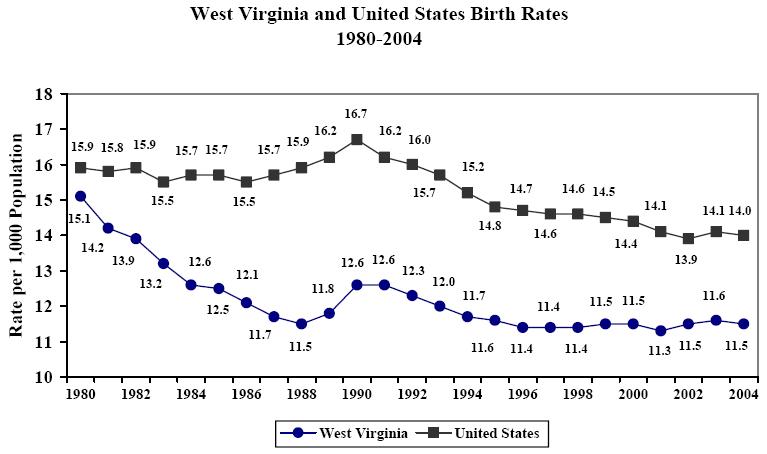
West Virginia resident live births decreased by 43, from 20,986 in 2003 to 20,946 in 2004. The
2004 birth rate of 11.5 per 1,000 population also declined, from 11.6 in 2003. The U.S. 2004
birth rate was 14.0 live births per 1,000 population, lower than 2003 (14.1). As the graph below
shows, West Virginia’s birth rate has been below the national rate since 1980. It has
continued its overall decline, interrupted by slight upturns in 1989 through 1991, 1999, 2002, and 2003.
The 2004 U.S. fertility rate of 66.3 live births per 1,000 women aged 15-44 was 0.4% higher than the 2003 rate (66.1). West Virginia’s fertility rate also increased 4.3% from 56.1 in 2003 to 58.5 in 2004. A comparison of West Virginia and United States age-specific fertility rates is displayed below:
| Fertility Rates* by Age Group West Virginia and United States, 2004 |
|||||
|---|---|---|---|---|---|
| 15-19 | 20-44 | Total (15-44) | |||
| WV | U.S.** | WV | U.S.** | WV | U.S.** |
| 43.7 | 41.2 | 61.1 | 71.0 | 58.5 | 66.3 |
* All fertility rates were calculated using 2004 estimates. U.S. Department of Commerce, Bureau of the Census.
** National Center for Health Statistics, National Vital Statistics Report, Vol. 54, No. 8, December 29, 2005.
The fertility rate among women aged 15-19 in West Virginia was 6.2% higher than that among young women in the U.S. (43.7 vs. 41.2). The fertility rate among women aged 20-44 was lower (13.9%) in the state than in the nation (61.1 vs. 71.0).
The number of births to teenage mothers decreased by 82 (3.2%), from 2,576 in 2003 to 2,494 in 2004. The percentage of total births represented by teenage births decreased from 12.3% in 2003 to 11.9% in 2004. The significantly lower fertility rate among older women, however, resulted in teenage births continuing to constitute a higher proportion of total births than is found nationally (10.3% in 2003).
The percentage of births occurring out of wedlock rose from 2003; in 2004, over one out of every three (34.7%) West Virginia resident births was to an unwed mother. The percentages of white and black births that occurred out of wedlock in West Virginia in 2004 were 33.5% and 76.8%, respectively, compared to 33.1% and 75.4% in 2003. In the United States in 2004, 29.3% of white births (non-Hispanic) and 66.8% of births to black mothers (non-Hispanic) occurred out of wedlock. The percentage of teenage births to unmarried teenage mothers in the state increased from 76.1% in 2003 to 76.5% in 2004.
There were a total of 1,956 low birthweight babies (those weighing less than 2,500 grams or 5½ pounds) born to West Virginia residents in 2004, 9.4% of all births. Of the l,948 low birthweight infants with known gestational age, 1,338 or 68.9% were preterm babies born before 37 weeks of gestation. (Of all 2004 resident births with a known gestational age, 12.3% were preterm babies.) Of the births with known birthweight, 14.3% of babies born to black mothers and 9.3% of babies born to white mothers were low birthweight. Nationally, 8.1% of all infants weighed less than 2,500 grams at birth in 2004; 7.3% of white infants and 13.7% of black infants were of low birthweight.
Eighty-six percent (86.0%) of West Virginia mothers with known prenatal care began their care during the first trimester of pregnancy, compared to 83.9% of mothers nationwide in 2004. Among those with known prenatal care, 86.4% of the white mothers began care during the first trimester; 76.4% of black mothers did so. (U.S. figures show 88.9% of white mothers and 76.5% of black mothers. Please check again later) No prenatal care was received by 0.6% of white mothers and by 2.3% of black mothers.
Over one-fourth (26.8%) of the 20,943 births in 2004 were to mothers who smoked during their pregnancies, while 0.6% of births were to women who used alcohol. National figures show that 10.2% of women giving birth reported smoking during pregnancy and 0.8% used alcohol. Of the state mothers who reported smoking during pregnancy, 14.3% of the babies born were low birthweight, compared to 7.3% for non-smoking mothers. 2002 U.S. statistics show 12.2% births to smoking mothers were low birthweight and 7.5% for non-smoking mothers. Nearly one-third (33.1%) of 2004 state births were delivered by Cesarean section, compared to a national rate of 29.1%. One or more complications of labor and/or delivery were reported for 33.8% of deliveries in the state in 2004.
Top of PageDeaths
The number of West Virginia resident deaths decreased by 431, from 21,299 in 2003 to 20,868 in 2004. The state’s crude death rate also dropped from 11.8 per 1,000 population in 2003 to 11.5 in 2003. The average age at death for West Virginians was 72.5 (69.0 for men and 75.9 for women). One hundred and seventeen West Virginia residents who died in 2004 were age 100 or older. The oldest woman was 110 years old at the time of death, while the oldest man was 104 years old.
Heart disease, cancer, chronic lower respiratory diseases, and stroke, the four leading causes of death, accounted for 61.8% of West Virginia resident deaths in 2004. Compared to 2003, the number of state deaths due to heart disease decreased 8.8% while cancer deaths increased 1.9%. Deaths due to chronic lower respiratory diseases, which surpassed stroke for the fourth time in the past five years, decreased 5.3%, while stroke mortality decreased 7.3%. Diabetes mellitus deaths increased 7.8%, while the number of reported deaths due to pneumonia and influenza decreased (8.5%) from 2003 to 2004. Alzheimers disease, now the seventh leading cause of death in the Mountain State for the second year in a row, only increased by just one death or 0.2%. Accident mortality increased marginally by 139 (14.4%), from 966 in 2003 to 1,105 in 2004. Motor vehicle accident deaths continued to number fewer than the 435 deaths in 1993, the year the West Virginia seatbelt law took effect; they increased by 17 (4.3%) from 392 in 2003 to 409 in 2004. Accidental poisoning deaths has been on the rise in West Virginia for the past five years, from 58 in 2000 to 127 in 2001; 156 in 2002; 252 in 2003; and 306 in 2004.
Accidents were the leading cause of death for ages one through 44 years. Even with the precipitous drop in motor vehicle accident deaths between 1993 and 1994, such fatalities remained the single leading cause of death for young adults aged 15 through 34, accounting for 26.0% of all deaths for this age group in 2004, compared with 26.2% in 2003. West Virginia’s 2004 motor vehicle fatalities included five children under five years of age, compared to four in 2002. Accidental poisoning accounted for 19.0% of all deaths in the age group of 15-34.
Suicides increased by only five (278 to 283, or 1.8%) between 2003 and 2004. Male suicides increased by two or 0.9 %, from 234 in 2003 to 236 in 2004; the number of female suicides (47) increased by three or 6.8% from 2003. Over two-thirds (67.8%) of all suicide deaths were firearm related — 73.3% of male suicides and 40.4% of female suicides. The average age of death for a suicide victim in 2004 was 45.2 years. While suicide was the 11th leading cause of death overall, it was still the second leading cause of death for ages 15-34. The number of suicides among persons aged 19 and under rose by just one from 12 in 2003 to 13 in 2004.
Homicides decreased by thirteen, from 92 in 2003 to 79 in 2004. Fifty-three (53) of the homicide victims were male, 26 were female. The average age at death for a homicide victim in 2004 was 38.9 years. There were two homicide victims under the age of five in 2004, compared to five in 2003. Nearly two-thirds (65.8%) of 2004 homicide deaths were due to firearms.
Top of PageYears of Potential Life Lost (YPLL)
YPLL is a measure of mortality, calculated as the difference between age 75 (an average life span) and the age at death. Using YPLL before age 75, the sum of YPLL across all causes of death represents the total YPLL for all persons dying before the age of 75. A person dying at the age of 45 would therefore contribute 30 years to the total YPLL (75-45=30). YPLL is an important tool in emphasizing and evaluating causes of premature death. In our previous reports, data for YPLL before age 65 were presented.
The YPLL from all causes decreased very slightly (0.1%), from 161,585 YPLL in 2003 to 160,426 in 2004. The four leading causes of YPLL in 2003 were malignant neoplasms (34,821 YPLL), diseases of the heart (24,747 YPLL), non-motor vehicle accidents (16,534 YPLL), and motor vehicle accidents (13,739 YPLL). Combined, these four causes accounted for over half (55.7%) of all years of potential life lost in 2004. In comparison to 2003, YPLL attributable to malignant neoplasms decreased from 22.3% to 21.6%. YPLL due to diseases of the heart decreased from 17.9% to 15.3% and YPLL due to non-motor vehicle accidents increased from 9.0% to 10.2%. The percentage of total YPLL due to motor vehicle crashes increased, from 8.1% to 8.5%.
Top of PageInfant Deaths
Deaths of infants under one year of age rose by five, from 153 in 2003 to 158 in 2004. West Virginia state’s infant mortality rate also increased, from 7.3 per 1,000 live births in 2003 to 7.5. The U.S. infant mortality rate decreased minimally, from 7.0 (6.96) in 2002 to 6.9 (6.95) in 2003. (We have to use 2003 data for now)
The following table shows the decline in the national and state infant mortality rates from 1950 through 2003.
1950-2004 Infant Mortality
West Virginia and United States
(Number and Rate per 1,000 Live Births)
| Year | West Virginia | United States |
|---|---|---|
| 1950 | 31.4 | 29.2 |
| 1955 | 27.1 | 26.4 |
| 1960 | 25.3 | 26.0 |
| 1965 | 27.1 | 24.5 |
| 1970 | 23.3 | 20.0 |
| 1975 | 18.3 | 16.1 |
| 1980 | 11.8 | 12.6 |
| 1985 | 10.7 | 10.6 |
| 1990 | 9.8 | 9.1 |
| 1995 | 7.6 | 7.5 |
| 1996 | 7.2 | 7.2 |
| 1997 | 9.5 | 7.2 |
| 1998 | 8.1 | 7.2 |
| 1999 | 7.6 | 7.1 |
| 2000 | 7.6 | 6.9 |
| 2001 | 7.3 | 6.9 |
| 2002 | 9.1 | 7.0 |
| 2003 | 7.3 | 6.9 |
| 2004 | 7.5 | N/A |
The state’s 2004 white infant mortality rate increased 7.2%, from 6.9 in 2003 to 7.4, while the rate for black infants decreased (23.7%), from 19.8 to 15.1 (see statistical variation in Methodology on page 9). West Virginia’s 2004 race-specific infant mortality rates and comparable 2003 U.S. rates are shown in the table below.
2004 West Virginia and 2003 United States
Infant Mortality by Race
(Number and Rate per 1,000 Live Births)
| Race of Infant | West Virginia | United States | ||
|---|---|---|---|---|
| Number | Rate | Number | Rate | |
| All Races | 158 | 7.5 | 28,428 | 6.9 |
| White | 147 | 7.4 | 18,768 | 5.8 |
| Black | 10 | 15.1 | 8,437 | 14.1 |
| Other | 1 | 2.6 | 1,223 | 4.6 |
Approximately one in ten (9.5%) infant deaths in 2004 was due to SIDS (sudden infant death syndrome). Twenty-three percent (22.8%) were the result of congenital malformations, while 53.8% were due to certain conditions originating in the perinatal period, including disorders relating to short gestation and unspecified low birthweight (10.8%).
Top of PageNeonatal/Postneonatal Deaths
The number of neonatal deaths rose by six, from 95 in 2003 to 101 in 2004; the neonatal death rate also increased from 4.5 deaths among infants under 28 days per 1,000 live births in 2003 to 4.8 in 2004. Neonatal deaths comprised 63.7% of all West Virginia resident infant deaths in 2004, compared to 62.1% in 2002. The rate of postneonatal deaths decreased from 2.8 deaths per 1,000 neonatal survivors in 2003 to 2.7 in 2004. The 2003 U.S. neonatal death rate was 4.7, while the postneonatal rate was 2.2 deaths per 1,000 neonatal survivors.
Top of PageFetal Deaths
The 135 resident fetal deaths occurring after 20 or more weeks of gestation reported in 2004 were six more than in 2003 (129). The fetal death ratio also increased from 6.1 deaths per 1,000 live births in 2003 to 6.5 in 2004. The majority (88.9%) of fetal deaths were due to conditions originating in the perinatal period, including complications of placenta, cord, and membrane (31.9%), maternal conditions (3.7%), maternal complications (10.4%), short gestation and low birthweight (8.9%), and other ill-defined perinatal conditions (25.2%). Congenital malformations accounted for 11.1% of all fetal deaths.
Top of PageMarriages
For the fourth year in a row and following a dramatic increase due to the passage of a new law that became effective June 2, 1999*, the number of marriages in West Virginia decreased from 13,697 in 2003 to 13,622 in 2004. The marriage rate in 2004 was 7.5 per 1,000 population, down from 7.6 in 2003. The 2004 U.S. provisional rate was 7.6.
For all marriages in 2004, the median age for brides was 27 and for grooms was 30. For first marriages, the median age for brides was 23 and for grooms was 26. The mode (most frequently reported age) for all marriages was 24 for both brides and grooms and for first marriages was 22 for brides and 24 for grooms.
Top of PageDivorces and Annulments
The number of divorces decreased by 186 or 2.0%, from 9,335 in 2003 to 9,149 in 2004. The 2004 rate of 5.0 per 1,000 population was down from the 2002 rate of 5.2.
Of the 9,149 divorces in West Virginia in 2004, the median duration of marriage was 7 years. Over half (53.5%) of the divorces involved no children under 18 years of age in the family, while one child was involved in 23.4% of all divorces and two children were involved in 17.4%. Three divorces involved six children.
Top of PageSummary
The number of West Virginia resident births decreased by 43 from 20,986 in 2003 to 20,943 in 2004. West Virginia resident deaths also decreased from 21,299 in 2003 to 20,868 in 2004. The number of infant deaths increased by five, from 153 in 2003 to 158 in 2004. Fetal deaths of 20 or more weeks gestation rose from 129 in 2003 to 135 in 2004. Marriages decreased for the fourth time in six years, from 13,697 in 2003 to 13,622 in 2004, while divorces also decreased from 9,335 in 2003 to 9,149 in 2004.