"2003 Vital"
Tables
Population
Birth
Death
Marriage
Divorce
County
Other Information
Graphs
Methodology
Definitions
Rates and Ratios
ICD10 Codes
Credits

"2003 Vital"
Tables
Population
Birth
Death
Marriage
Divorce
County
Other Information
Graphs
Methodology
Definitions
Rates and Ratios
ICD10 Codes
Credits
| Population | Live Births | Deaths | YPLL | Infant Deaths | Neonatal/postneonatal deaths | Fetal Deaths | Marriages | Divorces and Annulments | Summary |
For the seventh year in a row, more state residents died than were born. In 2003, 304 West Virginians were lost to the total population as a result of natural decrease, the excess of deaths over births. The rate of natural decrease was 0.2 persons per 1,000 population. Results from the 2003 Census estimate show an overall increase (approximately 0.1%) in the state’s population since 2000, from 1,808,344 to 1,810,354. This increase is the result of a slight growth in the excess of inmigration over outmigration during that span.
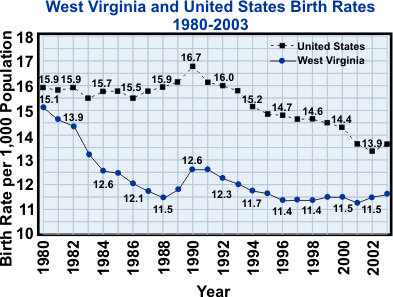
West Virginia resident live births increased by 230, from 20,725 in 2002 to 20,955 in 2003. The 2003 birth rate of 11.6 per 1,000 population also rose from 11.5 in 2001. The U.S. 2003 birth rate was 14.1 live births per 1,000 population, lower than 2002 (13.9). As the graph below shows, West Virginia’s birth rate has been below the national rate since 1980. It has continued its overall decline, interrupted by slight upturns in 1989 through 1991, 1999, 2002, and 2003.<
The 2002 U.S. fertility rate of 66.1 live births per 1,000 women aged 15-44 was 2.0% higher than the 2002 rate (64.8). West Virginia’s fertility rate also, increased 0.7% from 55.6 in 2002 to 56.0 in 2003. A comparison of West Virginia and United States age-specific fertility rates is displayed below:
| Fertility Rates* by Age Group West Virginia and United States, 2003 |
|||||
|---|---|---|---|---|---|
| 15-19 | 20-44 | Total (15-44) | |||
| WV | U.S.** | WV | U.S.** | WV | U.S.** |
| 41.6 | 41.7 | 58.7 | 70.5 | 56.1 | 66.1 |
The fertility rate among women aged 15-19 in West Virginia was 1.0% higher than that among young women in the U.S. (42.1 vs. 41.7). The fertility rate among women aged 20-44, however, was 16.9% lower in the state than in the nation (58.6 vs. 70.5).
The number of births to teenage mothers decreased by 76 (2.9%), from 2,646 in 2002 to 2,570 in 2003. The percentage of total births represented by teenage births decreased from 12.8% in 2002 to 12.3% in 2003. The significantly lower fertility rate among older women, however, resulted in teenage births continuing to constitute a higher proportion of total births than is found nationally (10.3% in 2003).
The percentage of births occurring out of wedlock rose from 2002, and now, over one out of every three (34.4%) West Virginia resident births was to an unwed mother. The percentages of white and black births that occurred out of wedlock in West Virginia in 2003 were 33.1% and 75.7%, respectively, compared to 31.6% and 72.1% in 2002. In the United States in 2003, 29.0% of white births and 70.0% of births to black mothers (final numbers not available) occurred out of wedlock. The percentage of teenage births to unmarried teenage mothers in the state noticeably increased from 71.4% in 2002 to 76.1% in 2003.
There were a total of 1,384 (of known BW) low birthweight babies (those weighing less than 2,500 grams or 5½ pounds) born to West Virginia residents in 2003, 8.0% of all births. Of the 1,380 low birthweight infants with known gestational age, 1,123 or 81.4% were preterm babies born before 37 weeks of gestation. (Of all 2003 resident births with a known gestational age, 11.7% were preterm babies.) Of the births with known birthweight, 11.2% of babies born to black mothers and 7.8% of babies born to white mothers were low birthweight. Nationally, 7.9% of all infants weighed less than 2,500 grams at birth in 2003; 7.0% of white infants and 13.5% of black infants were of low birthweight.
Eighty-six percent (85.8%) of West Virginia mothers with known prenatal care began their care during the first trimester of pregnancy, compared to 84.3% of mothers nationwide in 2003. Among those with known prenatal care, 86.4% of the white mothers began care during the first trimester; 73.3% of black mothers did so. (U.S. figures show 85.5% of white mothers and 76.1% of black mothers.) No prenatal care was received by 0.6% of white mothers and by 1.1% of black mothers.
Over one-fourth (26.4%) of the 20,955 births in 2003 were to mothers who smoked during their pregnancies, while 0.4% of births were to women who used alcohol. National figures show that 11.0% of women giving birth reported smoking during pregnancy and 0.8% used alcohol. Of the state mothers who reported smoking during pregnancy, 13.6% (2002, no idea what 2003 is) of the babies born were low birthweight, compared to 7.7% (2002, no idea what 2003 is) for non-smoking mothers. U.S. statistics show 12.2% (2002, no idea what 2003 is) births to smoking mothers were low birthweight and 7.5% (2002, no idea what 2003 is) for non-smoking mothers. Over thirty percent (31.8%) of 2003 state births were delivered by Cesarean section, compared to a national rate of 27.6%. One or more complications of labor and/or delivery were reported for 32.1% of deliveries in the state in 2003 (2002, no idea what 2003 is).
Effective in 1999, the National Center for Health Statistics (NCHS) and World Health Organization (WHO) adopted the 10th revision to the International Classification of Diseases -- now known as ICD-10. This is the first revision since 1979 and includes a more comprehensive classification of causes of death. Previously, all causes of death were coded numerically. Now all causes of death are coded alpha-numerically, allowing many more possible causes (Table 42, pages 95-121). When comparing 1999 deaths to earlier years, differences between ICD-9 coding and ICD-10 coding must be taken into account. Appendix B contains a more detailed explanation of ICD-10, as well as the new selected causes of death listing.
The number of West Virginia resident deaths increased by 257, from 20,999 in 2002 to 21,256 in 2003. The state’s crude death rate remained the same at 11.7 per 1,000 population in 2002 and 2003. The average age at death for West Virginians was 72.8 (69.0 for men and 76.4 for women). One hundred and fifty West Virginia residents who died in 2003 were age 100 or older. The oldest woman was 108 years old at the time of death, while the oldest man was 105 years old.
Heart disease, cancer, chronic lower respiratory diseases, and stroke, the four leading causes of death, accounted for 63.2% of West Virginia resident deaths in 2003. Compared to 2002, the number of state deaths due to heart disease decreased 0.2% while cancer deaths decreased 0.7%. Deaths due to chronic lower respiratory diseases, which surpassed stroke for the fourth time in the past five years, increased 6.5%, while stroke mortality increased 4.8%. Diabetes mellitus deaths decreased 5.9%, while the number of reported deaths due to pneumonia and influenza increased substantially (30.2%) from 2002 to 2003. Alzheimer’s disease, now the seventh leading cause than of death in the mountain state, increased 14.9%. Mortality resulting from accidents increased by 14, from 947 in 2002 to 961 in 2003. Motor vehicle accident deaths continued to number fewer the 435 deaths in 1993, the year the West Virginia seatbelt law took effect; they decreased by 24 (5.8%) from 412 in 2002 to 388 in 2003. Accidental poisoning deaths increased substantially (60.9%), from 156 in 2002 to 252 in 2003.
Accidents were the leading cause of death for ages one through 44 years. Even with the precipitous drop in motor vehicle accident deaths between 1993 and 1994, such fatalities remained the single leading cause of death for young adults aged 15 through 34, accounting for 26.3% of all deaths for this age group in 2003, compared with 27.7% in 2002. West Virginia’s 2003 motor vehicle fatalities included four children under five years of age, compared to three in 2002.
Suicides increased by three (277 to 280, or 1.1%) between 2002 and 2003. Male suicides decreased 0.8 %, from 238 in 2002 to 236 in 2003; the number of female suicides (44) increased by five or 12.8% from 2002. Over seventy percent (71.1%) of all suicide deaths were firearm related — 74.2% of male suicides and 54.5% of female suicides. The average age of death for a suicide victim in 2003 was 47.4 years. While suicide was the 11th leading cause of death overall, it was still the second leading cause of death for ages 15-34. The number of suicides among persons aged 19 and under reduced from 22 in 2002 to 12 in 2003.
Homicides in West Virginia decreased by seven, from 98 in 2002 to 91 in 2003. Sixty-two (62) of the homicide victims were male, 29 were female. The average age at death for a homicide victim in 2003 was 39.6 years. There were three homicide victims under the age of five in 2003, compared to six in 2002. Almost seventy percent (69.2%) of 2003 homicide deaths were due to firearms.
YPLL is a measure of mortality, calculated as the difference between age 75 (an average life span) and the age at death. Using YPLL before age 75, the sum of YPLL across all causes of death represents the total YPLL for all persons dying before the age of 75. A person dying at the age of 45 would therefore contribute 30 years to the total YPLL (75-45=30). YPLL is an important tool in emphasizing and evaluating causes of premature death. In our previous reports, data for YPLL before age 65 were presented.
The YPLL from all causes decreased 1.1%, from 162,798 YPLL in 2002 to 161,002 in 2003. The three leading causes of YPLL in 2003 were once again malignant neoplasms (36,465 YPLL), diseases of the heart (29,066 YPLL), and motor vehicle accidents (12,989 YPLL). Combined, these three causes accounted for around half (48.8%) of all years of potential life lost in 2003. In comparison to 2002, YPLL attributable to malignant neoplasms increased from 21.5% of the total to 22.6%. YPLL due to diseases of the heart also increased from 17.2% to 18.1%, but the percentage of total YPLL due to motor vehicle crashes decreased, from 8.7% to 8.1%.
Deaths of infants under one year of age dropped substantially by 36, from 188 in 2002 to 152 in 2003. West Virginia’s infant mortality rate also decreased, from 9.1 per 1,000 live births in 2002 to 7.3. The U.S. provisional 2003 infant mortality rate was 6.7, down slightly from 6.9 in 2002.
The following table shows the decline in the national and state infant mortality rates from 1950 through 2003.
| 1950 - 2003 Infant Mortality West Virginia and United States (Number and Rate per 1,000 Live Births |
||
|---|---|---|
| Year | West Virginia | United States |
| 1950 1955 1960 1965 1970 1975 1980 1985 1990 1995 1996 1997 1998 1999 2000 2001 2002 2003 |
31.4 27.1 25.3 27.1 23.3 18.3 11.8 10.7 9.8 7.6 7.2 9.5 8.1 7.6 7.6 7.3 9.1 7.3 |
29.2 26.4 26.0 24.5 20.0 16.1 12.6 10.6 9.1 7.5 7.2 7.2 7.2 7.1 6.9 6.9 7.0 6.9 |
The state’s 2003 white infant mortality rate decreased 18.8%, from 8.5 in 2002 to 6.9, while the rate for black infants decreased even more (37.6%), from 28.2 to 20.5 (see statistical variation in Methodology on page 9). West Virginia’s 2003 race-specific infant mortality rates and comparable U.S. rates are shown in the table on the following page.
| 2003 West Virginia and United States Infant Mortality by Race (Number and Rate per 1,000 Live Births) |
||||
|---|---|---|---|---|
| Race of Infant |
West Virginia |
United States |
||
| Number | Rate | Number | Rate | |
| All Rades | 153 | 7.3 | 28,428 | 6.9 |
| White | 139 | 6.9 | 18,768 | 5.8 |
| Black | 14 | 19.8 | 8,437 | 14.1 |
| Other | 0 | 0.0 | 1,223 | 4.6 |
Approximately one in nine (11.8%) infant deaths in 2003 was due to SIDS (sudden infant death syndrome). Twenty-three percent (23.0%) were the result of congenital malformations, while 44.7% were due to certain conditions originating in the perinatal period, including disorders relating to short gestation and unspecified low birthweight (7.2%)
The number of neonatal deaths dropped by 15, from 109 in 2002 to 94 in 2003; the neonatal death rate also decreased from 5.3 deaths among infants under 28 days per 1,000 live births in 2002 to 4.5 in 2003. Neonatal deaths comprised 61.8% of all West Virginia resident infant deaths in 2003, compared to 58.0% in 2002. The rate of postneonatal deaths decreased from 3.8 deaths per 1,000 neonatal survivors in 2002 to 2.8 in 2003. The 2003 U.S. neonatal death rate was 4.7, while the postneonatal rate was 2.3 deaths per 1,000 neonatal survivors. (Don’t have 2003 US yet)
The 129 resident fetal deaths occurring after 20 or more weeks of gestation reported in 2003 were 11 fewer than 2002 (140). The fetal death ratio also decreased from 6.8 deaths per 1,000 live births in 2002 to 6.2 in 2003. The majority (90.7%) of fetal deaths were due to conditions originating in the perinatal period, including complications of placenta, cord, and membrane (32.6%), maternal conditions (2.3%), maternal complications (13.2%), short gestation and low birthweight (3.9%), and other ill-defined perinatal conditions (27.1%). Congenital malformations accounted for 9.3% of all fetal deaths.
For the third year in a row and following a dramatic increase due to the passage of a new law that became effective June 2, 1999*, the number of marriages in West Virginia decreased from 14,558 in 2002 to 13,694 in 2002. The marriage rate in 2003 was 7.6 per 1,000 population, down from 8.1 in 2002. The 2003 U.S. provisional rate was 7.5.
For all marriages in 2003, the median age for brides was 26 and for grooms 28. For first marriages, the median age for brides was 22 and for grooms was 24. The mode (most frequently reported age) for all marriages was 23 for both brides and grooms and first marriages; 22 for brides and 23 for grooms.
The number of divorces decreased by 96 or 1.0%, from 9,442 in 2002 to 9,346 in 2003. The 2003 rate of 5.2 per 1,000 population was the same as 2002. The 2000 U.S. provisional rate was 4.0 per 1,000 population.
Of the 9,346 divorces in West Virginia in 2003, the median duration of marriage was 7 years. Over half (52.4%) of the divorces involved no children under 18 years of age in the family, while one child was involved in 23.1% of all divorces and two children were involved in 17.8%. Seven divorces involved six or more children.
*The new law removed the three-day waiting period for persons aged 18 and older as well as the requirement for a blood test for syphilis.
Data used to prepare this report are taken from birth and death certificates, fetal death reports, marriage applications, and divorce reports occurring in calendar year 2003 and filed in the office of the West Virginia Registrar of Vital Statistics prior to December 5, 2004. Vital events occurring to West Virginia residents in other states and recorded in the office of the registrar by June 1 are also included in totals by residence.
Data on vital events can be reported in two ways: by county of residence or by county of occurrence. For example, Hardy County reported 125 deaths as occurring within the confines of the county. However resident deaths for the county for 2003 totaled 157. With the exception of Table 25, the mortality data presented in this report are based on county of residence, as county resident populations are used to calculate rates.
With the exception of Table 6, birth data are similarly reported by county of residence.
All statistics contain variations that are the result of chance. This characteristic is of particular importance in classifications of events with small numbers, where small variations are proportionately large in relation to base figures. For example, small changes in the number of deaths or births in small population areas or in the number of deaths from uncommon causes could result in large changes in the respective rates. For this reason, rates for counties with small populations or other small bases should be used with caution.
Table 38 presents the number of infant deaths broken down by the race of mother while the table on page 6 in the summary has the number of infance deaths broken down by race of infant.
The county has been used as the basic unit of tabulation throughout this report. Data have also been supplied for public health management districts and for the total state. In some instances, data have been supplied for individual cities.
The cause of death is coded from information contained in the medical certification section of the death certificate. This portion of the certificate is completed by the attending physician. In the case of unattended death, the medical examiner is responsible for investigation and certification.
Effective in 1999, the National Center for Health Statistics and the World Health Organization adopted the Tenth Revision of the International Classification of Diseases Adapted for Use in the United States, 1999 (ICD-10). The deaths with codes A00 through T98 and Z00-Z99 were coded using the “nature of injury” causes, while those with codes V01 through Y98 were coded using the “external cause” of death. The external codes are used to indicate a death due to an external rather than an internal cause. Thus, a death from a gunshot wound would be coded using an external code, while a death due to cancer would not have an external code.
In several tables individual causes of death have been grouped into important selected causes of death. See Appendix B, “Groupings of ICD-10 Codes,” for a listing of the selected causes of death and Appendix D, “NCHS Supplements,” for an explanation of ICD-10.
The rates given in this publication were calculated using the 2003 estimated population figures from the U.S. Department of Commerce, Bureau of the Census.
The following is a list of the certificates and forms used in obtaining the data used in this publication. A sample copy of each can be found in Appendix A.
>Suggestions and comments on alternate methods of data presentation are welcome. Forward any suggestions to the following address:
Health Statistics Center
Office of Epidemiology and Health Promotion
350 Capitol Street, Room 165
Charleston, WV 25301
Telephone: (304) 558-9100
FAX: (304) 558-1787
E-Mail: vitalreg@bph.wvdhhr.org
The impact of chance variation must be considered in evaluating categories with small frequencies. For example, a small change in the number of infant deaths in a county can disproportionately affect the infant mortality rate for that county. Rates for cities and counties therefore require special consideration. Regional and state rates, with larger frequencies, provide more accurate data overall.
Rates used in this report are calculated with the 2003 estimated population figures from the U.S. Department of Commerce, Bureau of the Census.
Birth Rate (Crude) = (Number of live births / Population) X 1,000
Fertility Rate = (Number of live births to women aged 15-44 / Number of women aged 15-44) X 1,000
Teenage Fertility Rate = (Number of live births to women aged 15-19 / Number of women aged 15-19) X 1,000
Death Rate (Crude) = (Number of deaths / Population) X 1,000
Cause of Death Rate = (Number of deaths from a stated cause / Population) X 100,000
Infant Death Rate = (Number of infant deaths / Number of live births) X 1,000
Neonatal Death Rate = (Number of neonatal deaths / Number of live births) X 1,000
Fetal Death Ratio = (Number of fetal deaths / Number of live births) X 1,000
Maternal Death Rate = (Number of
maternal deaths / Number of live births
) X 100,000
GROUPINGS OF ICD-10 CODES
ICD-10 CODE SELECTED CAUSE
A15-A19 Tuberculosis
A40-A41 Septicemia
B20-B24 Human Immunodeficiency Virus Infection
C00-C97 Malignant Neoplasms
C15-C26 --of Digestive Organs
C18 ----of Colon
C25 ----of Pancreas
C30-C39 --of Respiratory and Intrathoracic Organs
C33-C34 ----Trachea, Bronchus, and Lung
C50 --of Breast
C51-C68 --of Genitourinary Organs
C53 ----Cervix Uteri
C56 ----Ovary
C61 ----Prostate
C67 ----Bladder
--All Other (Malignant Neoplasms)
D00-D48 Benign Neoplasms, Carcinoma in Situ, and Neoplasms of Unspecified Nature
E10-E14 Diabetes Mellitus
G30 Alzheimer’s Disease
I00-I78 Major Cardiovascular Diseases
I00-I09, I11, I13,
I20-I51 --Diseases of the Heart
I20-I25 ----Ischemic Heart Disease
I10, I12 –Essential Hypertension and Hypertensive Renal Disease
I60-I69 --Cerebrovascular Disease
I70 --Arteriosclerosis
I71-I78 --Other Diseases of the Arteries, Arterioles, and Capillaries
J10-J18 Influenza and Pneumonia
J10-J11 –Influenza
J12-J18 –Pneumonia
J40-J47 Chronic Lower Respiratory Diseases
J40-J43, J45-J46 --Bronchitis, Emphysema, and Asthma
J60-J70 Lung Diseases Due to External Agents
J60 --Coal Worker’s Pneumoconiosis
K70, K73-K74 Chronic Liver Disease and Cirrhosis
N00-N07, N17-N19,
N25-N27 Nephritis, Nephrotic Syndrome, and Nephrosis
Q00-Q99 Congenital Anomalies (Congenital Malformations, Deformations, and Chromosomal
Abnormalities)
R95-R99 Ill-Defined and Unknown Causes of Death
V01-X59,
Y85-Y86 Accidents
V02-V04,V09.0,V09.2,V12-V14,V19.0-V19.2, V19.4-V19.6,V20-V79,
V80.3-V80.5,V81.0-V81.1,V82.0-V82.1,V83-V86,V87.0-V87.8, V88.0-V88.8,
V89.0,V89.2 --Motor Vehicle
W00-W19 --Falls
X00-X09 –Smoke, Fire, and Flames
W65-W74 --Drownings
--All Other (Accidents)
X60-X84, Y87.0 Intentional Self-Harm (Suicide)
X85-Y09, Y87.1 Assault (Homicide)
All Other Causes (Residual)
165
A publication of:
The West Virginia Department of Health and Human Resources (DHHR),
Bureau for Public Health (BPH),
Office of Epidemiology and Health Promotion (OEHP),
Health Statistics Center (HSC),
| WV | DHHR| BPH | OEHP | HSC | PUBLICATIONS | TOP OF PAGE |
For information or questions concerning page contents, please contact:
Health Statistics Center
Room 165
350 Capitol Street
Charleston, WV 25301-3701
(304) 558-9100
dhhrvitalreg@wv.gov

 The
Health Statistics Center is a Division of the:
The
Health Statistics Center is a Division of the:
State of West Virginia - WV
Department of Health and Human Services - DHHR
Bureau for Public Health - BPH
Office of Epidemiology and Health Promotion - OEHP
Last updated 9/21/05.