| |
|
||||||||||||||||||||||||||||||||||||||||||||||||||||||||||||||||||||||||||||||||||||||||||||||||||||||||||||||||||||||||||||||||||||||||||||||||||||||||||||||||||||||||||||||||||||||||||||||||||||||||||||||||||||||||||||||||||||||||||||||||||||||||||||||||||||||||||||||||||||||||||||||||||||||||||||||||||||||||||||||||||||||||||||||||||||||||||||||||||||||||||||||||||||||||||||||||||||||||||||||||||||||||||||||||||||||||||||||||||||||||||||||||||||||||||||||||||||||||||||||||||||||||||||||||||||||||||||||||||||||||||||||||||||||||||||||||||||||||||||||||||||||||||||||||||||||||||||||||||||||||||||||||||||||||||||||||||||||||||||||||||||||||||||||||||||||||||||||||||||||||||||
Birth Defects Surveillance System, 1990-1999
|
||||||||||||||||||||||||||||||||||||||||||||||||||||||||||||||||||||||||||||||||||||||||||||||||||||||||||||||||||||||||||||||||||||||||||||||||||||||||||||||||||||||||||||||||||||||||||||||||||||||||||||||||||||||||||||||||||||||||||||||||||||||||||||||||||||||||||||||||||||||||||||||||||||||||||||||||||||||||||||||||||||||||||||||||||||||||||||||||||||||||||||||||||||||||||||||||||||||||||||||||||||||||||||||||||||||||||||||||||||||||||||||||||||||||||||||||||||||||||||||||||||||||||||||||||||||||||||||||||||||||||||||||||||||||||||||||||||||||||||||||||||||||||||||||||||||||||||||||||||||||||||||||||||||||||||||||||||||||||||||||||||||||||||||||||||||||||||||||||||||||||||
| Table One | ||||
|---|---|---|---|---|
| Birth Defects Records by Source West Virginia Residents, 1990-1999 |
||||
| Year | Birth Defects Registry |
Births Not in Registry |
Fetal Deaths |
Total Combined Records |
| 1990 | 496 | 439 | 16 | 951 |
| 1991 | 526 | 266 | 4 | 796 |
| 1992 | 449 | 315 | 2 | 766 |
| 1993 | 490 | 285 | 0 | 775 |
| 1994 | 519 | 283 | 1 | 803 |
| 1995 | 566 | 330 | 4 | 900 |
| 1996 | 562 | 278 | 5 | 845 |
| 1997 | 682 | 270 | 4 | 956 |
| 1998 | 471 | 229 | 3 | 703 |
| 1999 | 400 | 199 | 2 | 601 |
| Total | 5,161 | 2,894 | 41 | 8,096 |
* Death of a fetus with a gestational age of at least 20 weeks.
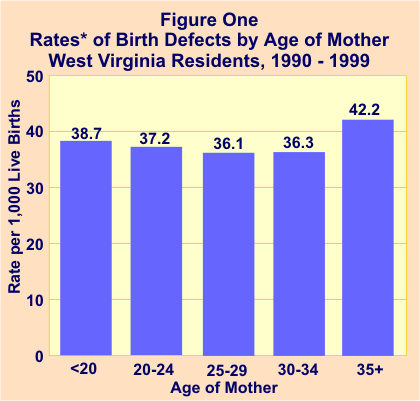
A demographic factor that influences the rate of birth defects is maternal age. Women 35 years and older have higher rates of children with birth defects than those of younger ages, 42.2 defects per 1,000 live births, as compared to 37.7 for women of all ages.
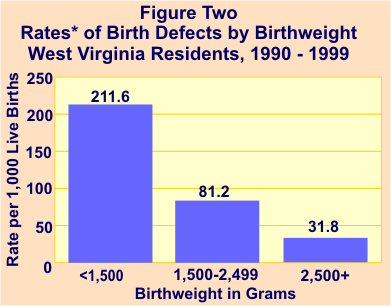
The weight of infants at the time of birth is an important factor affecting the rate of birth defects. In infants that weighed less than 1,500 grams (three pounds, five ounces) a rate of 211.6 per 1,000 live births was observed. Babies between 1,500 and 2,499 grams (five pounds, eight ounces) had defects at a rate of 81.2. Of infants who weighed 2,500 grams or more, only 31.8 per 1,000 live births had defects.
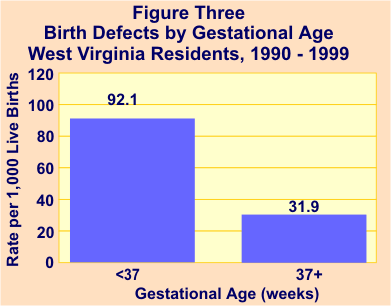
There is a marked difference in the rates of birth defects between premature births and infants who are born after a normal gestational period. Children with a gestational age of less than 37 weeks were diagnosed with one or more congenital anomalies at a rate of 92.1 per 1,000 live births. However, those with a gestational age of 37 weeks or more were diagnosed at a rate of 31.9 per 1,000 live births.
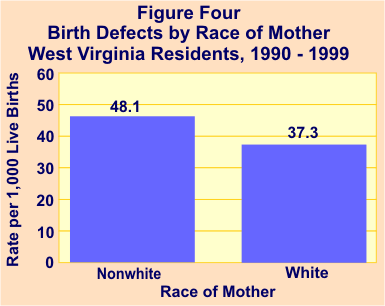
There is a measurable difference between the observed rates of birth defects among white mothers and mothers of other races. Children of mothers of other races had a reported rate of birth defects of 48.1 per 1,000 live births, while children of white mothers were observed to have birth defects at a rate of 37.3 per 1,000 live births.
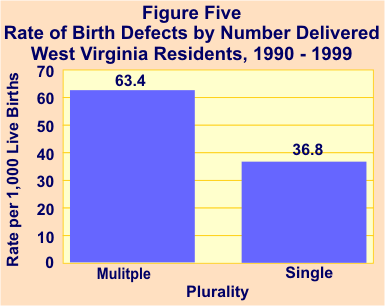
Multiple births is another factor that tends to increase the rate of birth defects. Singleton births produce a rate of 36.8 birth defects per 1,000 live births. In contrast, twins, triplets, and quadruplets collectively have birth defects at a rate of 63.4, nearly twice that of singleton births.
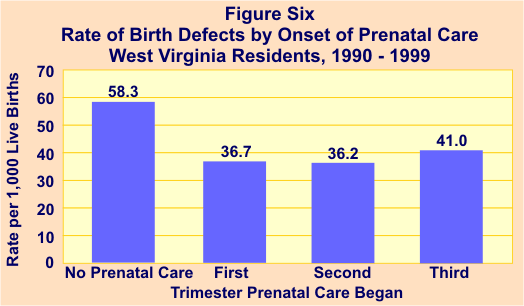
The timeliness of prenatal care affects the rate of birth defects. Those women who received no prenatal care produced children with defects at a rate of 58.3 per 1,000 live births. In contrast, those who began prenatal care in the first trimester of pregnancy gave birth to children with defects at a rate of 36.7 and those who started prenatal care during the second trimester produced children with defects at a rate of 36.2. Those who waited until the third trimester had a birth defect rate of 41.0.
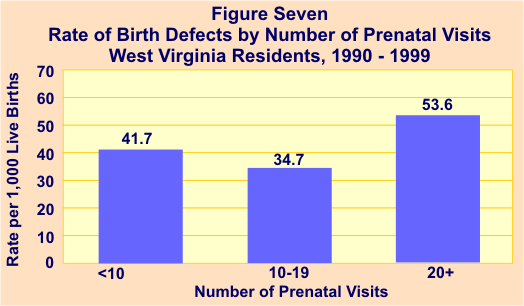
As with timeliness, the quantity of prenatal care affects the rate of birth defects. Those women who visited their obstetricians fewer than 10 times before giving birth produced children with defects at a rate of 41.7 per 1,000 live births. Those who had 10 to 19 prenatal visits gave birth to children with defects at a rate of 34.7. However, those who had 20 or more prenatal visits, most likely those known to have pregnancy complications, produced children with defects at a much higher rate, 53.6 per 1,000 live births.
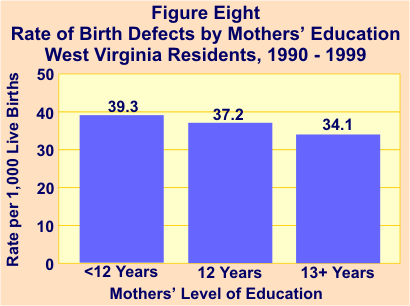
The prevalence of birth defects declines as the education level of mothers increases. Mothers with less than 12 years of education gave birth to children with defects at a rate of 39.3 per 1,000 live births. Those with 12 years of education produced children with defects at a rate of 37.2. Mothers who had 13 or more years of education gave birth to children with defects at an even smaller rate, 34.1 per 1,000 live births.
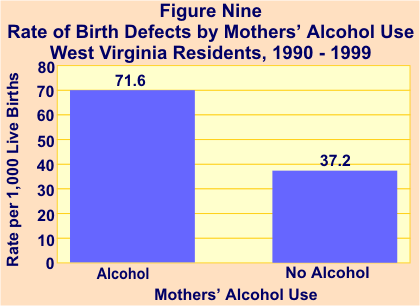
Women who consume alcohol greatly increase the risk of giving birth to children with defects. Children of women who did not consume alcohol had a reported rate of 37.2 birth defects per 1,000 live births. However, women who drank alcoholic beverages during pregnancy gave birth to children with birth defects at an observed rate of 71.6.
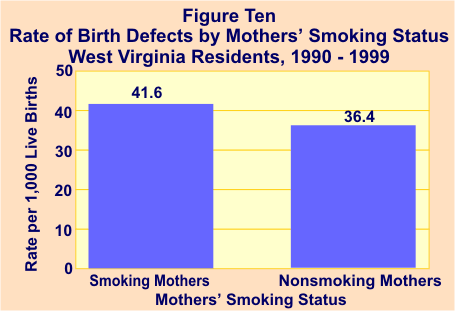
Children of mothers who smoked during pregnancy have a higher risk of birth defects than those whose mothers did not smoke. Mothers who smoked gave birth to children with birth defects at a rate of 41.6 per 1,000 live births, as compared to a rate of 36.4 among children of mothers who did not smoke during pregnancy.
The rate of birth defects by county of residence varies widely (see Table
Two). Fayette County had the highest observed rate, 62.0 per 1,000 live
births, followed by Raleigh County (56.2) and Berkeley County (54.3).
The lowest observed rates were in Mercer County (20.9), Logan County (23.5),
and Kanawha County (24.6).
| Table Two Birth Defects by County of Residence West Virginia Residents, 1990 - 1999 |
|||||||
|---|---|---|---|---|---|---|---|
| County of Residence |
Births With Defects |
Rate per 1,000 Live Births |
County Rank |
County of Residence |
Births With Defects |
Rate per 1,000 Live Births |
County Rank |
| Barbour | 86 | 48.1 | 7 | Monongalia | 414 | 47.4 | 10 |
| Berkeley | 500 | 54.3 | 3 | Monroe | 38 | 27.5 | 48 |
| Boone | 100 | 30.7 | 39 | Morgan | 66 | 45.1 | 14 |
| Braxton | 60 | 38.7 | 25 | Nicholas | 103 | 34.5 | 34 |
| Brooke | 101 | 38.3 | 26 | Ohio | 286 | 50.4 | 5 |
| Cabell | 457 | 38.7 | 24 | Pendleton | 30 | 33.2 | 36 |
| Calhoun | 35 | 42.7 | 18 | Pleasants | 26 | 29.9 | 43 |
| Clay | 38 | 28.8 | 45 | Pocahontas | 33 | 32.9 | 37 |
| Doddridge | 33 | 40.2 | 21 | Preston | 154 | 45.5 | 12 |
| Fayette | 358 | 62.0 | 1 | Putnam | 161 | 28.1 | 47 |
| Gilmer | 33 | 44.9 | 15 | Raleigh | 495 | 56.2 | 2 |
| Grant | 59 | 42.9 | 17 | Randolph | 153 | 46.6 | 11 |
| Greenbrier | 145 | 36.8 | 31 | Ritchie | 39 | 35.5 | 33 |
| Hampshire | 88 | 38.1 | 28 | Roane | 48 | 28.4 | 46 |
| Hancock | 95 | 27.3 | 50 | Summers | 53 | 43.3 | 16 |
| Hardy | 45 | 31.4 | 38 | Taylor | 88 | 53.3 | 4 |
| Harrison | 328 | 38.1 | 27 | Tucker | 40 | 49.5 | 6 |
| Jackson | 81 | 25.9 | 52 | Tyler | 31 | 30.0 | 41 |
| Jefferson | 208 | 40.9 | 20 | Upshur | 108 | 40.2 | 22 |
| Kanawha | 622 | 24.6 | 53 | Wayne | 202 | 39.8 | 23 |
| Lewis | 75 | 37.7 | 30 | Webster | 31 | 27.3 | 49 |
| Lincoln | 77 | 27.2 | 51 | Wetzel | 94 | 41.1 | 19 |
| Logan | 118 | 23.5 | 54 | Wirt | 19 | 29.9 | 44 |
| McDowell | 118 | 30.0 | 42 | Wood | 396 | 36.8 | 32 |
| Marion | 245 | 37.9 | 29 | Wyoming | 147 | 47.9 | 8 |
| Marshall | 190 | 47.6 | 9 | ||||
| Mason | 97 | 33.3 | 35 | ||||
| Mercer | 167 | 20.9 | 55 | WV Total | 8,096 | 37.7 | |
| Mineral | 143 | 45.3 | 13 | ||||
| Mingo | 135 | 30.3 | 40 | ||||
| County of Residence |
Births With Defects |
Rate per 1,000 Live Births |
County Rank |
County of Residence |
Births With Defects |
Rate per 1,000 Live Births |
County Rank |
As with data by county, a wide variance is observed in the reporting of birth defects by hospital of birth (see Table Three). Of hospitals where at least 100 births occurred during the time period of 1990 - 99, the highest observed rates of birth defects were recorded at West Virginia University Hospital, with a rate 92.5 birth defects per 1,000 live births, City Hospital (63.8), and Calhoun General Hospital (63.0). The lowest rates were reported at New River Birthing Center (4.5), Putnam General Hospital (10.0), and Putnam Birthplace (11.8). The difference in rates by hospital may be more a measurement of completeness of reporting than the health of the babies delivered in the various facilities. In addition, birthing centers and smaller hospitals refer high-risk pregnancies to the state's three tertiary care hospitals, i.e., WVU Hospital, CAMC, and Cabell-Huntington Hospital, a possible factor in WVU Hospital's high rate. Other issues such as the quality of prenatal care available at the surveyed facilities may also be factors in rate variation.
| Table Three Birth Defects by Hospital1 of Birth by Source of Report West Virginia Residents, 1990-1999 |
|||||||
|---|---|---|---|---|---|---|---|
| Hospital of Birth | Birth Defects Registry |
Vital Statistics2 |
Combined Birth Defects |
||||
| Number | Rate | Number | Rate | Number | Rate | Rank | |
| Bluefield Regional Medical Center | 89 | 17.6 | 28 | 5.5 | 117 | 23.1 | 30 |
| CAMC - Women & Children's | 729 | 19.9 | 160 | 4.4 | 889 | 24.3 | 29 |
| Cabell-Huntington Hospital | 586 | 35.7 | 93 | 5.7 | 679 | 41.3 | 8 |
| Calhoun General Hospital | 13 | 54.6 | 2 | 8.4 | 15 | 63.0 | 3 |
| Camden-Clark Memorial Hospital | 167 | 22.9 | 49 | 6.7 | 216 | 29.6 | 22 |
| City Hospital | 410 | 50.5 | 108 | 13.3 | 518 | 63.8 | 2 |
| Davis Memorial Hospital | 188 | 34.9 | 32 | 5.9 | 220 | 40.9 | 9 |
| Fairmont General Hospital | 136 | 21.9 | 23 | 3.7 | 159 | 25.7 | 26 |
| Grant Memorial Hospital | 65 | 20.7 | 38 | 12.1 | 103 | 32.8 | 15 |
| Greenbrier Valley Hospital | 89 | 18.5 | 72 | 14.9 | 161 | 33.4 | 13 |
| Jackson General Hospital | 11 | 9.4 | 12 | 10.3 | 23 | 19.7 | 33 |
| Jefferson Memorial Hospital | 20 | 10.0 | 46 | 23.0 | 66 | 33.0 | 14 |
| Logan General Hospital | 70 | 11.6 | 51 | 8.5 | 121 | 20.1 | 32 |
| Monongalia General Hospital | 91 | 20.8 | 17 | 3.9 | 108 | 24.7 | 27 |
| New River Birthing Center | 0 | 0.0 | 1 | 4.5 | 1 | 4.5 | 37 |
| Ohio Valley Medical Center | 63 | 24.7 | 31 | 12.2 | 94 | 36.8 | 10 |
| Pleasant Valley Hospital | 25 | 22.3 | 14 | 12.5 | 39 | 34.7 | 11 |
| Preston Memorial Hospital | 40 | 22.7 | 17 | 9.6 | 57 | 32.3 | 16 |
| Princeton Community Hospital | 27 | 5.1 | 62 | 11.7 | 89 | 16.8 | 34 |
| Putnam Birthplace | 2 | 7.9 | 1 | 3.9 | 3 | 11.8 | 35 |
| Putnam General Hospital | 1 | 10.0 | 0 | 0.0 | 1 | 10.0 | 36 |
| Raleigh General Hospital | 146 | 8.8 | 885 | 53.1 | 1,031 | 61.8 | 4 |
| Reynolds Memorial Hospital | 41 | 21.2 | 13 | 6.7 | 54 | 27.9 | 24 |
| Roane General Hospital | 13 | 8.9 | 23 | 15.8 | 36 | 24.7 | 28 |
| St. Joseph's Hospital (Wood) | 190 | 39.3 | 21 | 4.3 | 211 | 43.6 | 7 |
| St. Joseph's Hospital (Upshur) | 56 | 21.5 | 26 | 10.0 | 82 | 31.4 | 18 |
| St. Mary's Hospital | 37 | 9.0 | 53 | 12.8 | 90 | 21.8 | 31 |
| Stonewall Jackson Memorial Hospital | 67 | 26.4 | 14 | 5.5 | 81 | 31.9 | 17 |
| Summersville Memorial Hospital | 31 | 12.1 | 36 | 14.1 | 67 | 26.2 | 25 |
| Thomas Memorial Hospital | 162 | 36.3 | 35 | 7.9 | 197 | 44.2 | 6 |
| United Hospital Center - Downtown | 171 | 18.0 | 127 | 13.4 | 298 | 31.4 | 19 |
| Weirton Medical Center | 52 | 20.8 | 24 | 9.6 | 76 | 30.4 | 21 |
| Welch Emergency Hospital | 26 | 13.4 | 31 | 16.0 | 57 | 29.4 | 23 |
| West Virginia University Hospital | 728 | 69.6 | 240 | 22.9 | 968 | 92.5 | 1 |
| Wetzel County Hospital | 32 | 19.6 | 18 | 11.0 | 50 | 30.6 | 20 |
| Wheeling Hospital | 339 | 47.6 | 18 | 2.5 | 357 | 50.1 | 5 |
| Williamson Memorial Hospital | 23 | 16.1 | 26 | 18.2 | 49 | 34.3 | 12 |
| West Virginia Total | 5,161 | 24.1 | 2,935 | 13.7 | 8,096 | 37.7 | |
Hospital of Birth |
Number | Rate | Number | Rate | Number | Rate | Rank |
| Birth Defects Registry |
Vital Statistics2 |
Combined Birth Defects |
|||||
| 1. Only hospitals with at least 100 births from 1990
through 1999 are included. 2. Birth records indicating a congenital anomaly not in the birth defects registry. | |||||||
This brief is intended only to provide statistical data on the numbers and rates of reported birth defect incidences from 1990-99 and does not include services available for children who have been affected. For more information on services available, please contact the Office of Maternal, Child and Family Health at 1-800-642-8522.
If you have questions concerning the content of this page, please contact the Health Statistics Center at (304) 558-9100 or dhhrvitalreg@wv.gov.
This page was last updated 04/23/02.
| |