 |
HSCStatistical BriefNumber 14April 2005 |
 |
The Burden of Arthritis in West Virginia, 2003
Arthritis, one of the most common conditions reported by the American population, actually comprises more than 100 diseases that involve the joints, the tissues that surround the joints, and other connective tissue. Affecting approximately 43 million Americans, it is the leading cause of disability in the United States, causing some level of activity limitation in nearly one in six affected, or more than 7 million people. It is estimated that by 2020, 60 million Americans, almost 20% of the population, will be affected by arthritis. Of these, one-fifth (12 million) will suffer activity limitations.
COSTS. In 2004, the Centers for Disease Control and Prevention (CDC) published estimates of the direct (medical care expenditures) and indirect (value of time lost from work among persons aged 18-64) costs of arthritis and other rheumatic conditions (AORC) in the United States in 1997. Data from the 1997 Medical Expenditure Panel Survey and the 2002 Behavioral Risk Factor Surveillance System (BRFSS) were used to calculate the estimates. The total costs in the nation in 1997 were estimated at $86.2 billion ($51.1 billion in direct costs and $35.1 billion in indirect costs). State-specific estimates were also generated: in West Virginia, a total of $750 million was expended in 1997 on AORC, $445 million in direct medical costs and $305 million in indirect costs.
PREVALENCE. The 2003 West Virginia BRFSS survey included several questions on arthritis and other rheumatic conditions. Over half of the respondents aged 18 and older (55.9%) reported symptoms of pain, aching, or stiffness in or around a joint (not including neck or back) during the previous 30 days. Of those, the symptoms of 84.5% had begun more than three months prior to the interview.
All respondents were then asked “Have you ever been told by a doctor or other health professional that you have some form of arthritis, rheumatoid arthritis, gout, lupus, or fibromyalgia?” Thirty-seven percent (37.2%) of West Virginia adults (an estimated 529,169 individuals) answered “yes” to this question, the highest rate among the 50 states, the District of Columbia, and the three territories that participated in the 2003 BRFSS. The state rate was significantly higher than that for the United States as a whole (27.1%; 95% CI: 26.8, 27.4). No significant difference was reported in the state by gender; 34.9% of men had AORC, compared with 39.3% of women. The rate of being diagnosed with AROC increased with age, from 7.4% of respondents aged 18-24 to 62.2% of those aged 65 and older. Adults with less education and lower incomes were more likely than others to have AORC. Table 1 below presents the prevalence of arthritis and other rheumatic conditions by gender, age, education, and income.
| Table 1. Prevalence (%)
of Arthritis and Other Rheumatic Conditions among Adults West Virginia Behavioral Risk Factor Surveillance System, 2003 |
|||||||||
|---|---|---|---|---|---|---|---|---|---|
| Characteristic | Men | Women | Total | ||||||
| # Resp. | % | 95% CI | # Resp. | % | 95% CI | # Resp. | % | 95% CI | |
| TOTAL | 1,313 | 34.9 | (32.1-37.8) | 2,016 | 39.3 | (37.0-41.7) | 3,329 | 37.2 | (35.4-39.0) |
| Age | |||||||||
| 18-24 | 91 | 6.4 | (0.8-12.1) | 111 | 8.3 | (2.9-13.8) | 202 | 7.4 | (3.4-11.3) |
| 25-34 | 186 | 20.4 | (14.0-26.8) | 268 | 15.3 | (10.6-20.0) | 454 | 17.8 | (13.9-21.8) |
| 35-44 | 234 | 30.0 | (23.6-36.3) | 320 | 27.1 | (21.7-32.5) | 554 | 28.5 | (24.3-32.7) |
| 45-54 | 282 | 41.0 | (34.7-47.2) | 386 | 40.5 | (35.3-45.7) | 668 | 40.7 | (36.7-44.8) |
| 55-64 | 248 | 49.7 | (43.0-56.4) | 395 | 60.4 | (55.2-65.6) | 643 | 55.1 | (50.9-59.4) |
| 65+ | 271 | 56.3 | (50.0-62.6) | 525 | 66.3 | (61.9-70.7) | 796 | 62.2 | (58.6-65.9) |
| Education | |||||||||
| Less than H.S. | 245 | 46.0 | (38.7-53.3) | 390 | 55.0 | (49.5-60.5) | 635 | 50.6 | (46.0-55.2) |
| H.S. or G.E.D. | 524 | 34.4 | (30.0-38.8) | 787 | 40.0 | (36.2-43.7) | 1,311 | 37.3 | (34.4-40.2) |
| Some Post-H.S. | 263 | 31.0 | (25.0-37.0) | 473 | 35.0 | (30.3-39.8) | 736 | 33.3 | (29.5-37.0) |
| College Graduate | 278 | 29.1 | (23.5-34.8) | 365 | 27.3 | (22.4-32.1) | 643 | 28.2 | (24.5-32.0) |
| Income | |||||||||
| Less than $15,000 | 171 | 51.1 | (42.3-59.9) | 354 | 50.6 | (44.6-56.5) | 525 | 50.8 | (45.7-55.9) |
| $15,000- 24,999 | 259 | 43.6 | (37.0-50.1) | 458 | 44.2 | (39.2-49.3) | 717 | 43.9 | (39.9-48.0) |
| $25,000- 34,999 | 193 | 38.4 | (31.0-45.9) | 268 | 37.8 | (31.5-44.1) | 461 | 38.1 | (33.2-42.9) |
| $35,000- 49,999 | 211 | 34.1 | (27.3-41.0) | 266 | 36.2 | (29.9-42.4) | 477 | 35.1 | (30.4-39.7) |
| $50,000- 74,999 | 168 | 29.2 | (21.9-36.5) | 225 | 24.4 | (18.4-30.5) | 393 | 26.8 | (22.0-31.6) |
| $75,000+ | 183 | 21.6 | (15.0-28.2) | 146 | 21.5 | (14.8-28.2) | 329 | 21.6 | (16.7-26.5) |
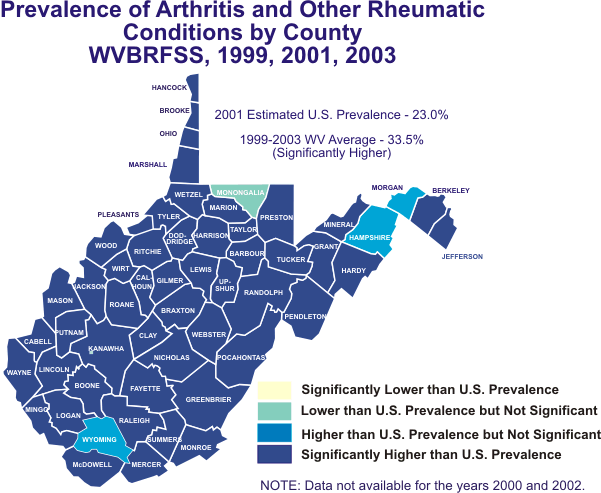
Arthritis prevalence data from the 1999, 2001, and 2003 BRFSS surveys were aggregated to provide county prevalence rates. McDowell County had the highest rate at 48.1%, while Monongalia County had the lowest rate (18.7%). The map on the following page illustrates the prevalence of AORC by county. (Individual county rates are found in Appendix A.)
LIMITATIONS. Arthritis-related limitations were ascertained through two additional BRFSS questions. Thirty-six percent (36.3%) of respondents who reported having had joint pain for at least three months answered “yes” to the question “Are you now limited in any way in your usual activities because of arthritis or joint symptoms?” This was the fourth highest rate among the 54 BRFSS participants; the national prevalence was 29.7% (95% CI: 29.3, 30.2). Thirty-twopercent (31.6%) of respondents who reported having had joint pain for at least three months and were aged 18 through 64 said “yes” when asked “Do arthritis or joint symptoms now affect where you work, the type of work you do, or the amount of work you do?” This rate was the fifth highest in the nation, where the overall rate was 26.0% (95% CI: 25.5, 26.6). Thirty-five percent (35.0%) of state men reported activity limitation, compared with 37.5% of women; 32.4% of men had some work limitation, compared with 30.8% of women. These differences were not statistically significant. In general, activity and work limitations increased with age and decreased with increasing education and income. Table 2 on page 4 presents the prevalence of arthritis-related limitations by gender, age, education, and income.
HOSPITAL DISCHARGE RECORDS. Hospital
discharge data1 provide an additional
perspective in the attempt to understand the prevalence of a condition
and the burden it imposes on society. 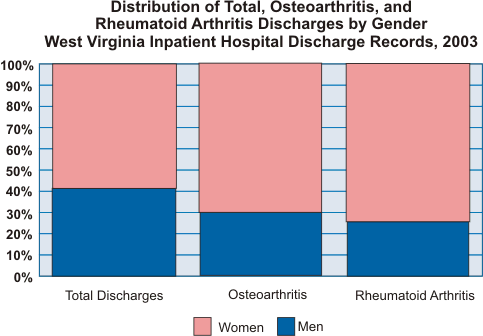 For this brief, hospital discharges
having a diagnosis of rheumatoid arthritis (ICD-9 codes 714.0-714.9)
or osteoarthrosis and allied disorders (ICD-9 codes 715.0-715.9) were
examined using data obtained from the Health IQ2003 website2 provided
by the West Virginia Health Care Authority. In 2003, out of a total
of approximately 298,448 discharges, an estimated 23,444 had arthritis
as either a principal or secondary diagnosis, representing nearly 1
in every 12 discharges. Women made up the majority of both total and
arthritis discharges, 59.3% and 70.5%, respectively.
For this brief, hospital discharges
having a diagnosis of rheumatoid arthritis (ICD-9 codes 714.0-714.9)
or osteoarthrosis and allied disorders (ICD-9 codes 715.0-715.9) were
examined using data obtained from the Health IQ2003 website2 provided
by the West Virginia Health Care Authority. In 2003, out of a total
of approximately 298,448 discharges, an estimated 23,444 had arthritis
as either a principal or secondary diagnosis, representing nearly 1
in every 12 discharges. Women made up the majority of both total and
arthritis discharges, 59.3% and 70.5%, respectively.
Of the 23,444 discharges having an arthritis diagnosis, 2,936 (12.5%) had a diagnosis of rheumatoid arthritis and 20,508 (87.5%) had an osteoarthritis diagnosis. Women were even more likely than men to have a rheumatoid arthritis diagnosis (75% vs. 25%) than an osteoarthritis diagnosis (70% vs. 30%). The graphic to the right illustrates the distribution of discharges by gender and type of arthritis diagnosis.
| Table 2. Prevalence (%)
of Arthritis-Related Limitations among Adults West Virginia Behavioral Risk Factor Surveillance System, 2003 |
||||||
|---|---|---|---|---|---|---|
| Characteristic | Arthritis or joint symptoms limit usual activities * | Arthritis or joint symptoms affect place of work, type of work, or amount of work ** | ||||
| # Resp. | % | 95% CI | # Resp. | % | 95% CI | |
| TOTAL | 1,992 | 36.3 | (34.0-38.7) | 1,405 | 31.6 | (28.8-34.3) |
| Sex | ||||||
| Males | 756 | 35.0 | (31.3-38.7) | 573 | 32.4 | (28.2-36.7) |
| Females | 1,236 | 37.5 | (34.5-40.4) | 832 | 30.8 | (27.3-34.2) |
| Age | ||||||
| 18-24 | 56 | 21.7 | (9.8-33.7) | 56 | 21.2 | (9.5-32.8) |
| 25-34 | 192 | 28.2 | (21.1-35.4) | 193 | 30.7 | (23.4-38.0) |
| 35-44 | 270 | 37.7 | (31.4-44.1) | 270 | 31.9 | (25.8-38.1) |
| 45-54 | 436 | 36.5 | (31.6-41.4) | 432 | 33.1 | (28.3-38.0) |
| 55-64 | 454 | 42.7 | (37.7-47.8) | 454 | 33.3 | (28.5-38.0) |
| 65+ | 579 | 37.8 | (33.6-42.1) | -- | -- | -- |
| Education | ||||||
| Less than H.S. | 447 | 49.7 | (44.5-55.0) | 244 | 50.3 | (43.0-57.6) |
| H.S. or G.E.D. | 791 | 36.0 | (32.3-39.7) | 570 | 34.3 | (29.9-38.7) |
| Some Post-H.S. | 434 | 30.3 | (25.5-35.0) | 332 | 23.0 | (18.1-28.0) |
| College Graduate | 318 | 26.0 | (20.8-31.2) | 259 | 16.9 | (11.9-21.9) |
| Income | ||||||
| Less than $15,000 | 377 | 57.6 | (51.8-63.4) | 236 | 55.1 | (47.7-62.5) |
| $15,000- 24,999 | 467 | 41.5 | (36.6-46.4) | 293 | 44.0 | (37.6-50.4) |
| $25,000- 34,999 | 262 | 30.1 | (24.0-36.2) | 194 | 31.3 | (23.8-38.8) |
| $35,000- 49,999 | 269 | 27.2 | (21.1-33.2) | 218 | 23.2 | (16.7-29.8) |
| $50,000- 74,999 | 202 | 26.4 | (19.6-33.2) | 186 | 15.3 | (9.9-20.8) |
| $75,000+ | 141 | 17.6 | (11.2-24.0) | 134 | 11.9 | (6.2-17.5) |
* Among adults who reported three months of joint pain or diagnosis of arthritis by a doctor or health care professional
** Among adults aged 18 to 64
WEST VIRGINIA ARTHRITIS COALITION. While the focus of the medical community is on treating arthritis in the individual patient, the public health approach targets the entire population. In order to impact the burden of arthritis in West Virginia, further definition of the problem in the state is of highest priority, i.e., identifying the needs of those residents who suffer from, or are at risk for, arthritis. Awareness of the condition and the fact that prevention strategies do exist, e.g., weight control, physical activity, injury prevention in sports and the workplace, and protection from tick bites and the potential for Lyme disease, must be emphasized, both to the general public and to health care providers. The importance of early diagnosis must also be stressed, for it is estimated that 200,000 people nationwide do not see a doctor even when arthritis is limiting their usual activities. To this end, the West Virginia Bureau for Public Health and the Arthritis Foundation, Ohio River Valley Chapter, are collaborating in the development of the West Virginia Arthritis Coalition. This statewide council, which held its first meeting in February 2005, is open to all organizations and individuals that are committed to improving the quality of life for people with arthritis. The coalition will initially focus on three primary areas: public awareness of arthritis, defining the burden of arthritis in the state, and educating primary care practitioners. For further information, contact Germaine Weis with the Bureau for Public Health, Office of Epidemiology and Health Promotion, at (304) 558-0644 or Germaine.C.Weis@wv.gov.
|
Appendix A Prevalence (%) of Arthritis and Other Rheumatic Conditions by County WVBRFSS 1999, 2001, 2003 |
|||||
|---|---|---|---|---|---|
| County | % | Rank* | County | % | Rank* |
Barbour |
36.4 |
12 |
Pendleton |
28.0 |
31 |
Note: The data from counties sharing the same rank were combined due to low sample sizes. Aggregated sample sizes were large enough for 24 of the 55 counties to stand alone. The data from the remaining 31 counties were combined into 12 groupings of counties. Each county within a grouping shares the same prevalence. *Rates are rounded to the nearest tenth; ranks were determined before rounding . |
|||||
1 Inpatient data from all nonfederal licensed hospitals in the state and Medicare data on West Virginia residents hospitalized in out-of-state hospitals. Up to nine diagnoses (one principal and eight secondary) are recorded.
2 http://www.hcawv.org/DataAndPublic/Data.htm