
HSC
Statistical
Brief 1 - Updated July 2006

 |
HSC |
 |
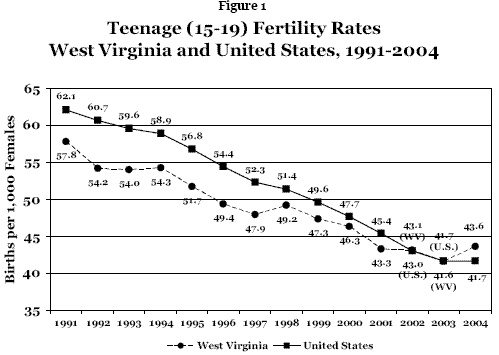
According to our inaugural statistical brief released in June 2000, fertility rates among teenagers aged 15 through 19 declined both nationally and statewide between 1991 and 1998. According to the National Center for Health Statistics, this decline continued in both West Virginia and the United States between 1998 and 2004.
Teenage fertility rates decreased by 17.2% in the United States between 1991 and 1998, from 62.1 births (per 1,000 females aged 15-19) to 51.4 births. They decreased an additional 18.9% over the next five years, to a rate of 41.7 in 2004. During the entire 14-year span, the national rate decreased by a total of 32.9%. In West Virginia, the teenage fertility rate declined 14.9% between 1991 and 1998, from 57.8 births to 49.2 births. There was an additional decrease (11.4%) to 43.6 births per 1,000 teenagers in 2004. Over the entire period, the Mountain State’s rate decreased by a total of 24.6%. Figure 1 illustrates the declines in state and national teenage fertility rates over the study period.
 (click images for larger image)
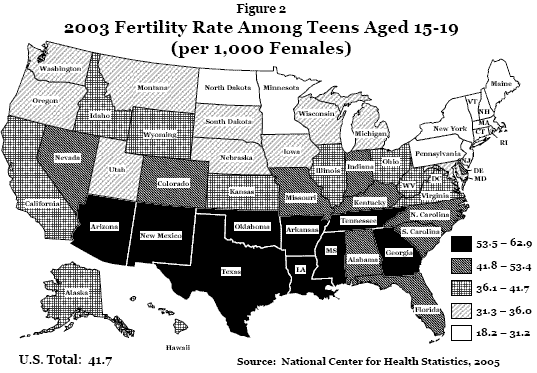
In 2003, West Virginia’s teenage fertility rate of 41.6 placed the state 21st among the 50 states and the District of Columbia (see Figure 2). Texas reported the highest teenage fertility rate in that year at 62.9 births per every 1,000 females aged 15 through 19, followed by New Mexico (62.7) and Mississippi (62.5). New Hampshire reported the lowest rate at 18.2. (Although 2004 information was available for West Virginia and the United States, 2003 data were the most recent available for other states at the time of this report.)
 (click images for larger image)
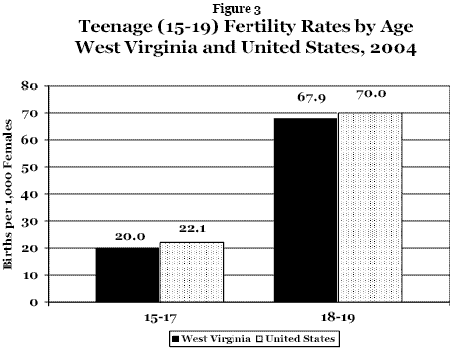
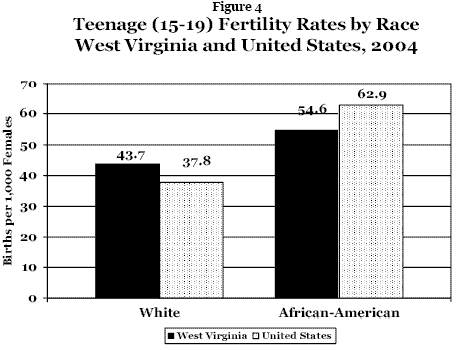
The difference in 2004 teenage fertility rates between females aged 15-17 and 18-19 is illustrated in Figure 3. West Virginia had a slightly lower fertility rate among both 15- through 17-year-olds and 18- and 19-year olds than the United States as a whole (20.0 vs. 22.1 and 67.9 vs. 70.0, respectively). By race, the state’s rate among white teenagers was slightly higher than the corresponding national rate in 2004 (43.7 vs. 37.8, respectively); however, the rate among the state’s African-American teenagers was lower than the national average (54.6 vs. 62.9, respectively) (Figure 4).
In order to examine changes in teenage fertility rates at the county level, two five-year aggregates were compared, 1995-1999 and 2000-2004. Of the state’s 55 counties, five had increases in their teenage fertility rates, while 50 had decreases (Figure 5). The largest decrease was recorded in Pocahontas County, from an average annual rate of 81.1 from 1995-1999 to 45.5 in 2000-2004, a 43.9% decline. Hancock County, on the other hand, reported an increase of 18.0% in its teenage fertility rate, from 36.9 during 1995-1999 to 43.5 in 2000-2004. The remaining four counties with increases in fertility rates were Monroe County (10.1%), Ritchie (5.5%), Wirt (1.3%), and Mineral (0.6%).
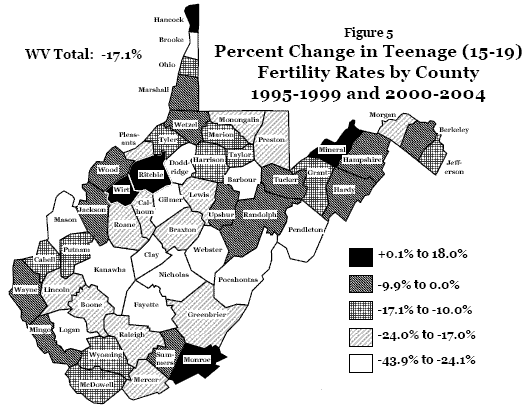
Tables 1 and 2 contain the individual fertility rates by state presented in Figure 2. Table 1 compares the differences between 1998 and 2003, while Table 2 presents data from 1991 and 2003. Table 3 contains the West Virginia county-level information provided in Figure 5. For further information, contact the West Virginia Health Statistics Center at (304) 558-9100.
If you have any questions, contact the Health Statistics Center at:
Phone: 304-558-9100 or
Email:dhhrvitalreg@wv.gov